


9-4 Chapter 9 Usage Monitor Operations
Hitachi Universal Replicator for IBM /OS User’s Guide
Displaying the Usage Monitor Graph
When usage monitoring is running, the Usage Monitor window can display
user-selected remote copy I/O statistics in real time.
The usage monitor graph plots the user-selected I/O statistics (up to 65 data
points) on an x-y graph. The x-axis displays time. The y-axis displays the
number of I/Os during the last sampling period. The legend (right side of the
graph) indicates the data being displayed. A value on the y-axis varies
according to the maximum value of the statistical data that is displaying. If the
value on the y-axis exceeds 10,000,000, the value is displayed in exponential
notation (e.g., 1E7 = 1×10
7
= 10,000,000; 2E8 = 2×10
8
= 200,000,000).
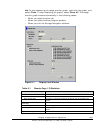
To display the usage monitor graph:
1. Make sure that usage monitoring is running (Monitoring Switch = Enable).
The usage monitor graph can only be displayed when monitoring is on.
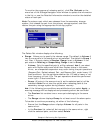
2. Right-click the graph area of the Usage Monitor window, and select Display
Item to open the Display Item window (see
Figure 9-1).
3. Select an appropriate radio button in Select Volume, following the
instructions below:
– If you want to display I/O statistics for all LDEVs to be monitored in the
storage system, select ALL Volumes.
– If you want to display I/O statistics for a specific journal group, select
JNL Group, and then enter a journal group number (00-FF).
Note: If you specify an unused journal group, the graph is not
displayed.
– If you want to display I/O statistics for a specific LDEV, select Volume,
and then specify the desired LDEV by entering an LDKC number (00-01),
a CU number (00-FE) and an LDEV number (00-FF).
Note: If you specify the un-mounted volume, the graph is not displayed.
Important: When a graph displays, the LDKC number, the CU number and
the LDEV number appear above the graph. If the volume is an external
volume, the symbol "#" appears after the LDEV number. For detailed
information about external volumes, please refer to the Universal
Volume Manager User's Guide.
4. In the Monitor Data box, select the I/O statistics data that you want to
display on the graph. You must select at least one box.
Table 9-1 describes
the I/O statistics data.
5. Select Set to close the Display Item window. The Usage Monitor window
now displays a graph showing the selected I/O statistics data for the
selected LU(s).
To enlarge the displayed graph, right-click the graph, and select the Large
Size command. To return the graph to normal size, right-click the graph,
and select the Normal Size command.