Debugging Your Application Chapter 4
NI-488.2 User Manual for Windows 4-4 © National Instruments Corp.
Debugging with wibic
If your application does not automatically check for and display errors, you can locate an
error by using wibic. Simply issue the same functions or routines, one at a time as they
appear in your application program. Because wibic returns the status values and error
codes after each call, you should be able to determine which GPIB call is failing. For
more information about wibic, refer to Chapter 5, wibic–Windows Interface Bus
Interactive Control Utility.
After you determine which GPIB call is failing and note the corresponding values of the
global variables, refer to Appendix A, Status Word Conditions, and Appendix B, Error
Codes and Solutions. These appendixes will help you interpret the state of the driver.
Debugging with GPIB Spy
The NI-488.2 software includes GPIB Spy, an applications monitor utility that is useful
as a debugging tool. You can use GPIB Spy to monitor the NI-488 and NI-488.2 calls
made by your Windows application. You can configure GPIB Spy to suspend the
execution of your application and display an information screen any time the error bit is
set in ibsta . For more information about GPIB Spy, refer to Chapter 6, GPIB Spy .
GPIB Error Codes
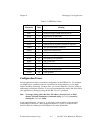
Table 4-1 lists the GPIB error codes. Remember that the error variable is meaningful
only when the ERR bit in the status variable is set. For a detailed description of each
error and possible solutions, refer to Appendix B, Error Codes and Solutions.


