


iTap GigaBit Dual Port Aggregator
19
Chapter 3
Using the Front Panel Interface
Overview
This chapter describes how to interpret and work with the front panel features of
the iTap GigaBit Dual Port Aggregator. The following topics are covered:
Display
LED indicators
Reset Button
The iTap front panel provides information in two ways. The displays shows utiliza-
tion and peak information and the LEDs show link status and alarm conditions.
The front panel also has a recessed reset button to clear the peak data.
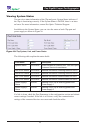
Display
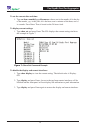
The front panel of the iTap provides network traffi c information on a 2x16
character LCD. After a bootup message, the display scrolls through the following
messages, advancing every fi ve seconds:
Display Message Description
% Util A = XX% Percent of Network Port A bandwidth being used by
incoming traffi c
% Util B = XX% Percent of Network Port B bandwidth being used by
incoming traffi c
Peak A = XX% Incoming traffi c peak on Network Port A as percent of
bandwidth
Peak B = XX% Incoming traffi c peak on Network Port B as percent of
bandwidth
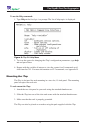
Time A = AAA, hh:
mm:ss
The day and time of the highest peak on Network Port A
since last reset where AAA is the day of the week and hh:
mm:ss is hours, minutes, and seconds on a 24-hour clock
Time B = AAA, hh:
mm:ss
The day and time of the highest peak on Network Port B
since last reset where AAA is the day of the week and hh:
mm:ss is hours, minutes, and seconds on a 24-hour clock
•
•
•