


iTap GigaBit Copper Port Aggregator
24
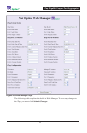
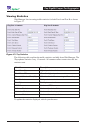
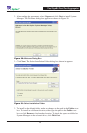
Viewing Statistics
Web Manager lists incoming traffi c statistics for both Port A and Port B as shown
in Figure 17.
Figure 17: iTap Statistics
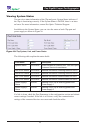
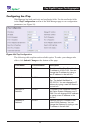
The following table explains the traffi c statistics available from Web Manager. The
iTap updates statistics every 15 seconds. All counters refl ect counts since the last
statistics reset.
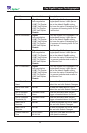
Field Name Description
Peak Rate (%) Highest peak since last reset
Peak Date & Time When the highest peak occurred
Current Utilization Rate (%) Utilization level of the incoming traffi c on the port
Total Packets Total packets received
Total Bytes Total bytes received
CRC Errors Number of CRC errors
Collision Packets Number of packet collisions
Undersize Packets Number of undersize packets
Oversize Packets Number of oversize packets
To update the statistics displayed, refresh your browser.