


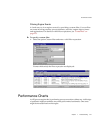

Performance Charts
224 iPlanet Integration Server • Process System Guide • August 2001
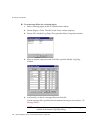
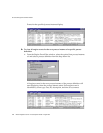
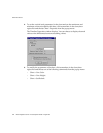
4. To set the vertical scale parameters for the chart and see the maximum and
minimum values recorded by this chart, click somewhere in the chart, then
right-click and choose Chart > Properties from the popup menu.
The Timeline Properties window displays. You can choose to display observed
values or the differences between succeeding values.
5. To modify the appearance of the chart, click somewhere in the chart, then
right-click and choose one of the following commands from the popup menu:
❍ Chart > Line Color
❍ Chart > Line Weight
❍ Chart > Set Default