


Statistics Worksheet 65
• When you enter data for one-variable statistics, Xnn represents the
value and
Ynn specifies the number of occurrences (frequency).
• When you enter a value for
Xnn, the value for Ynn defaults to 1.
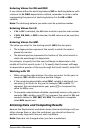
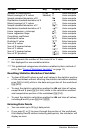
Analyzing One-Variable Statistics
To analyze one-variable statistics, select 1-V. Only values for n, v
vv
v, Sx, sX,
GX, and GX
2
are computed and displayed for one-variable statistics.
Analyzing Two-Variable Statistics
You can choose from among these four regression-analysis methods:
•LIN
•
Ln
• EXP
• PWR
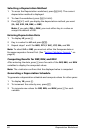
Computing Values Automatically
Except for the predicted X' and Y' values, the calculator computes and
displays values for statistics variables automatically when you access
them.
Using X' and Y' for Regression Predictions
To use the X' and Y' variables for regression predictions, you either can
enter a value for
X' to compute Y' or enter a value for Y' to compute X'.
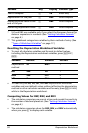
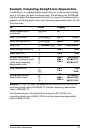
Regression Models
For two-variable data, the Statistics worksheet uses four regression
models for curve fitting and forecasting.
The calculator interprets the X value as the independent variable and the
Y value as the dependent variable.
The calculator computes the statistical results using these transformed
values:
•
LIN uses X and Y.
Model Formula Restrictions
LIN
Y = a + b X None
Ln
Y = a + b ln(X) All X values > zero
EXP
Y = a b
x
All Y values > zero
PWR
Y = a X
b
All X and Y values > zero