


ZyWALL 5/35/70 Series User’s Guide
Chapter 2 Introducing the Web Configurator 80
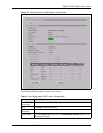
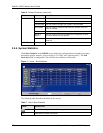
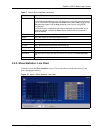
2.4.5 Show Statistics: Line Chart
Click the icon in the Show Statistics screen. This screen shows you the line chart of each
port’s throughput statistics.
Figure 12 Home : Show Statistics: Line Chart
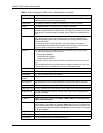
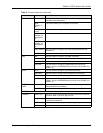
Status For the LAN and DMZ ports, this displays the port speed and duplex setting.
For the WAN and Dial Backup ports, this displays the port speed and duplex setting
if you’re using Ethernet encapsulation and Down (line is down), Idle (line (ppp) idle),
Dial (starting to trigger a call) or Drop (dropping a call) if you’re using PPPoE
encapsulation.
For the WLAN port, it displays the transmission rate when a wireless LAN card is
inserted and WLAN is enabled or Down when a wireless LAN is not inserted or
WLAN is disabled.
TxPkts This is the number of transmitted packets on this port.
RxPkts This is the number of received packets on this port.
Tx B/s This displays the transmission speed in bytes per second on this port.
Rx B/s This displays the reception speed in bytes per second on this port.
Up Time This is the total amount of time the line has been up.
System Up Time This is the total time the ZyWALL has been on.
Poll Interval(s) Enter the time interval for refreshing statistics in this field.
Set Interval Click this button to apply the new poll interval you entered in the Poll Interval(s)
field.
Stop Click Stop to stop refreshing statistics.
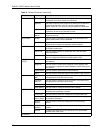
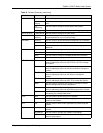
Table 7 Home: Show Statistics (continued)
LABEL DESCRIPTION