


Symmetra® MW with Internal Bypass Static Switch - User Guide - 990-1756A-001 7
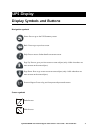
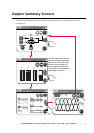
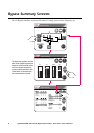
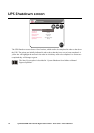
Output Summary Screens
The three Output Summary screens provide output-specific status of voltage, power, current,
frequency, etc.
Normal
~~
Q7 Q8
Normal
0:00 AM
Q2
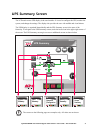
UPS Summary
Normal
Normal
Output Summary
5.40 PM
Page 1 of 3
587
522
456
391
326
262
196
130
65
L1 L2 L3
0
13 13
13
Current
A
495
440
365
330
275
220
165
110
55
0
450 453
Total Power
kW kVA
607
540
472
405
337
270
202
135
67
L1-2L2-3L3-1
0
Voltage
V
259 264 263
55.0
54.0
53.0
52.0
51.0
50.0
49.0
48.0
47.0
45.0
46.0
Frequency
Hz
259
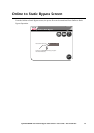
L1 L2 L3
L1 L2 L3
L1-2 L2-3 L3-1
Current
Current high
Peak current
Peak current high
THD
THD high
Crest factor
Crest factor high
Active power
Active power high
Apparent power
Apparent power high
Power factor
Total active power
Total apparent power
Frequency
Frequency high
Frequency low
Tolerance
Load
Load high
Total load
Total load high
Page 2 of 3
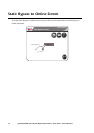
Voltage
Voltage high
Voltage low
THD
THD high
Voltage tolerance
Waveform tolerance
Tolerance conditions
Load
57.0
60.0
20.0
59.4
3.9
3.8
2.1
2.03
380
700
700
690
0.92
381
701
692
682
0.81
382
702
694
684
0.82
200
150
51.4
54.2
45.8
2.0
220.5
260.0
200.0
2.7
221.0
261.0
201.0
3.6
222.0
262.0
202.0
4.8
4.6
5
6
29
59.0
63.0
19.5
59.9
4.8
4.7
2.13
2.06
62.0
66.0
20.0
60.4
5.8
5.7
2.23
2.16
Normal
0:00 AM
Normal
Normal
Output Summary
5.40 PM
A
A
A
A
%
%
V
V
V
%
%
%
%
kW
kW
kVA
kVA
kW
kVA
Hz
Hz
Hz
%
60.0
58.0
68.0
66.0
78.0
76.0
142.0
250.0
%
%
%
%
Voltage
200.0
-200.0
0.0
Time (ms)
Current
Voltage
200.0
-200.0
0.0
0.0 5.0 10.0
Time (ms)
15.0
Current
Normal
Normal
Output Summary
5.40 PM
Page 3 of 3
Refresh Data
The black bars represent real-time
data. Yellow triangles represent the
maximum values recorded to date
and blue triangles represent the
minimum values recorded to date.
These values will be reset when the
output statistics are reset