Chapter 4
23 Avaya P130 SMON User Guide
The Port Statistics Window
The Port Statistics window is organized as follows:
The title of the Port Statistics window shows the IP address of the
device.
The X axis represents packets or percentage for Utilization.
The Y axis represents ports and LAGs. Each row on the graph
corresponding to a port or LAG is labeled on the Y axis with a port
number, LAG number, or with the user defined name for a port.
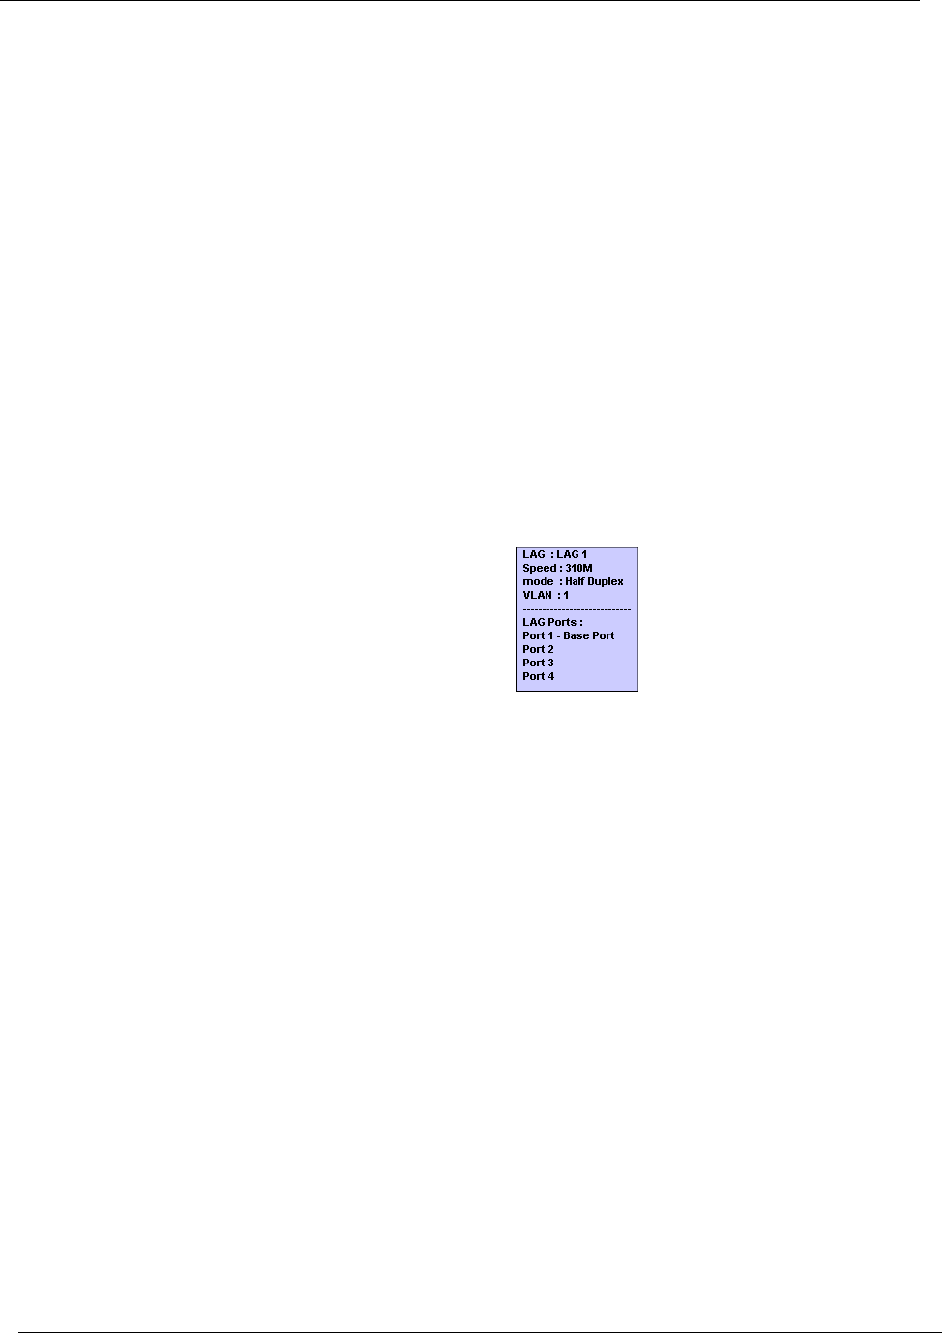
Link Aggregation Groups (LAGs) are displayed. These are a group
of ports serving as one logical link. When referencing the LAGs
information box (place your cursor over the LAG bar), each port
within the LAG appears. In addition, the speed of the LAG is the
sum of the speed of all the ports within the LAG.
Figure 4-2. LAG Information Box
To display user defined names for ports, open the
View
menu and select
Show User Defined Port Names
. A checkmark appears next to
Show User
Defined Port Names
, and the user defined names for ports are displayed in
the Port Statistics window.
To hide user defined names for ports, open the
View
menu and select
Show User Defined Port Names
. The checkmark next to
Show User Defined
Port Names
disappears, and port numbers are displayed in the Port
Statistics window.
* Note: For high-speed ports with large polling intervals, bandwidth
and utilization counters may be inaccurate.
For more information about modifying the display, and the available
toolbar, status bar, and mouse movement options, refer to Chapter 2,
Working with Device SMON Tools.


