


Chapter 5
25 Avaya P130 SMON User Guide
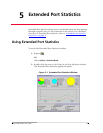
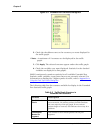
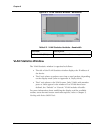
Extended Port Statistics displays information using two types of graphs:
Pie charts that shows the ratio of different types of packets.
A traffic graph section that contains line graphs describing the
characteristics of the traffic traveling through the port or LAG.
The title of the Extended Port Statistics window displays the name of the
port or LAG selected.
The pie charts show data for the time furthest to the right currently visible
on the traffic graph. For more information, refer to
Traffic Graph in the
Extended Port Statistics Window on page 26.
You can use the pie charts and the traffic graph to view data from an
earlier point in time by scrolling the traffic graph. For more information
on the available toolbar, status bar, and mouse movement options, refer
to Chapter 2, Working with Device SMON Tools.
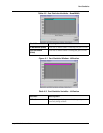
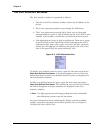
Pie Charts in the Extended Port Statistics Window
For Avaya P130 Devices, there are two pie charts at the top of the
window. The leftmost pie chart displays Packets Length Distribution and
the rightmost pie chart displays Packets Distribution. The following tables
provide a list of the statistics found in each of the pie charts:
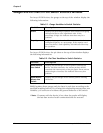
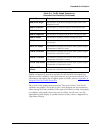
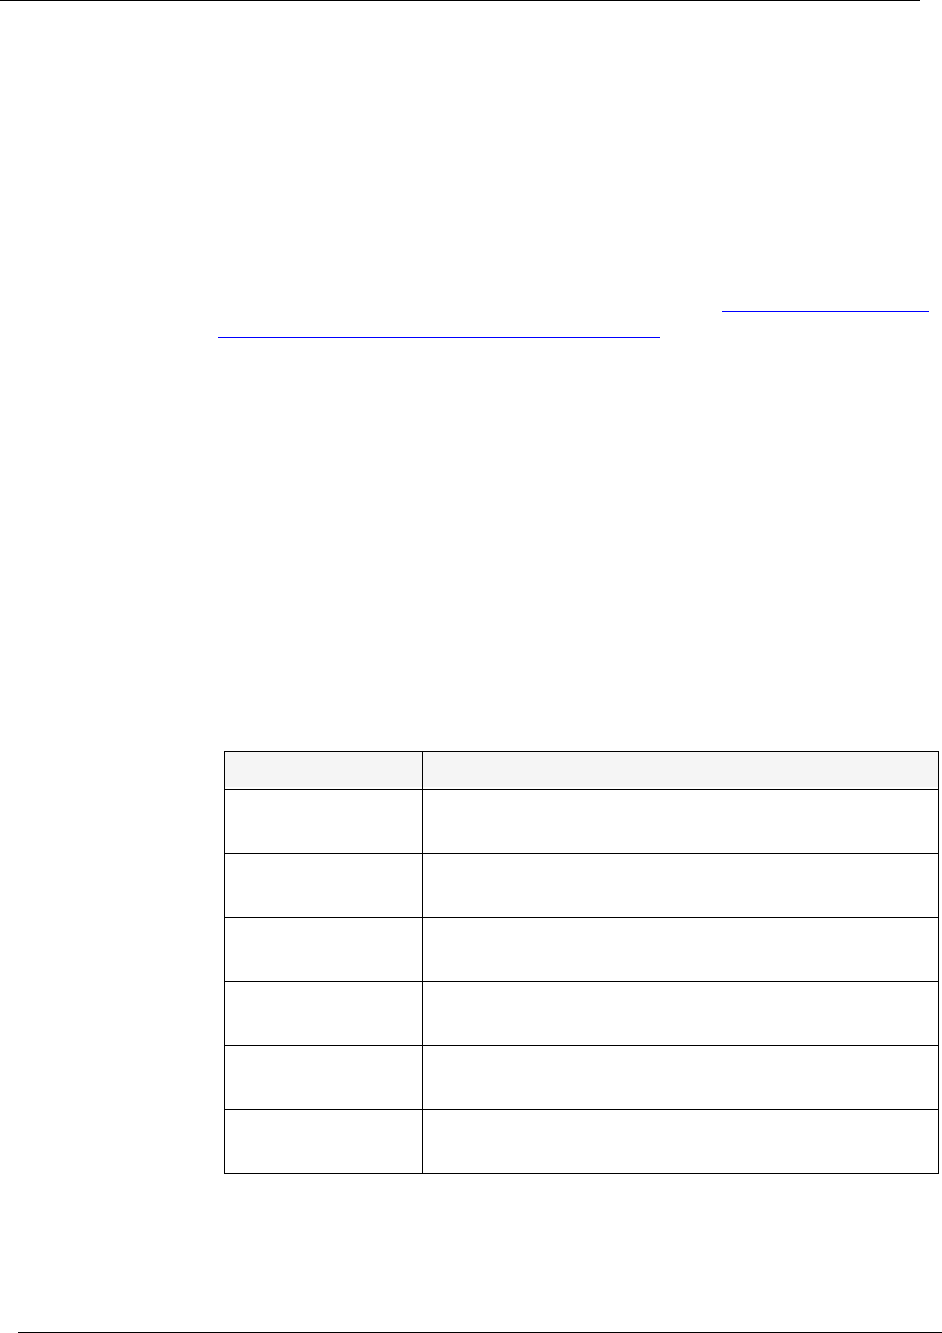
Table 5-1. Extended Port Statistics - Packets Length Distribution
Variable Description
64 Octet Displays the distribution of packets on the port with a
packet length of 64 octets.
65 to 127 Octets Displays the distribution of packets on the port with a
packet length of between 65 and 127 octets.
128 to 255 Octets Displays the distribution of packets on the port with a
packet length of between 128 and 255 octets.
256 to 511 Octets Displays the distribution of packets on the port with a
packet length of between 256 and 511 octets.
512 to 1023 Octets Displays the distribution of packets on the port with a
packet length of between 512 and 1023 octets.
1024 to 1518
Octets
Displays the distribution of packets on the port with a
packet length of between 1024 and 1518 octets.