Chapter 5
27 Avaya P130 SMON User Guide
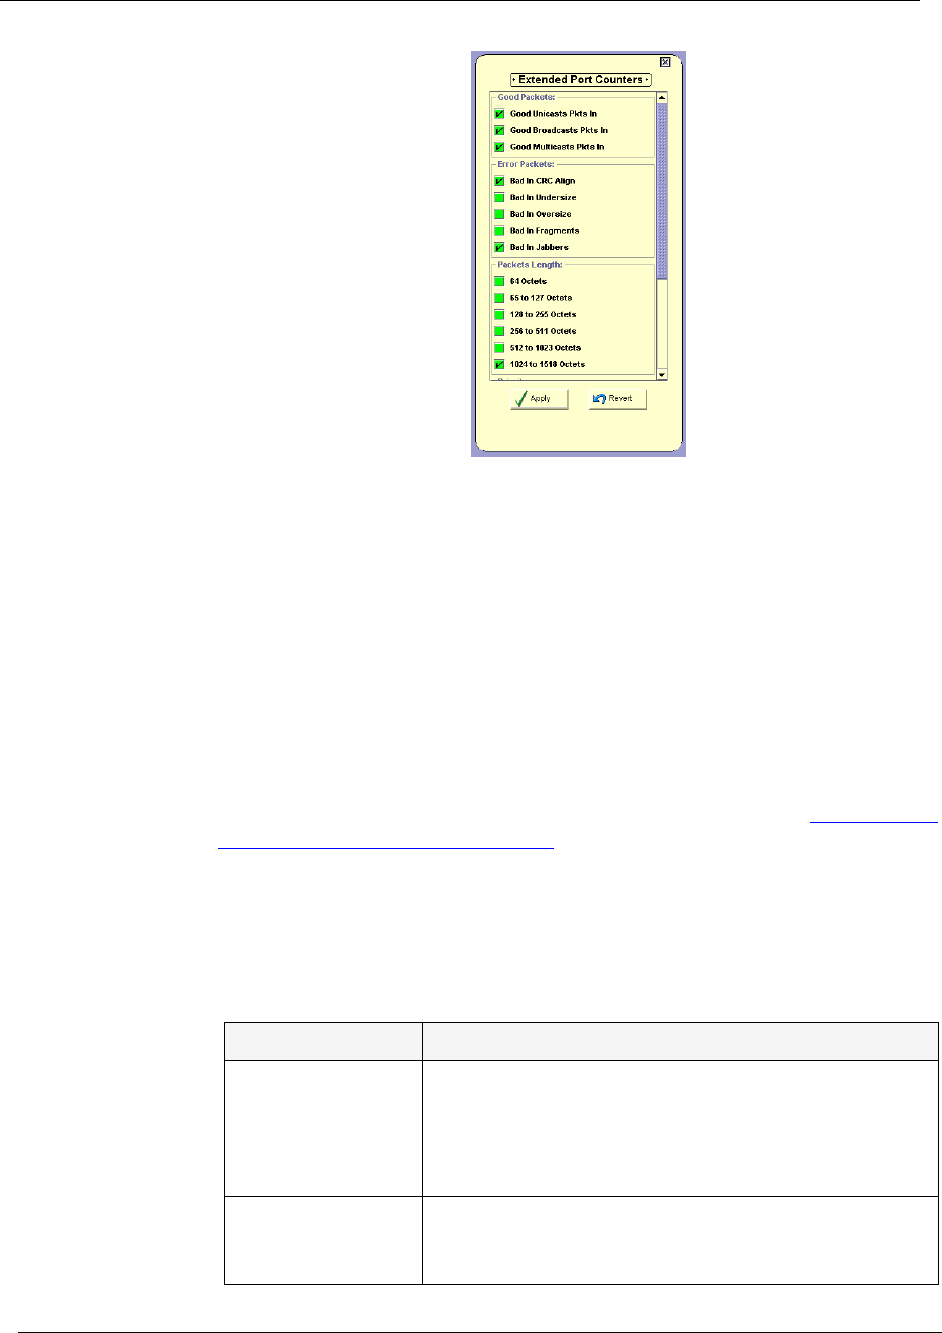
Figure 5-2. Extended Port Counters Dialog Box
2. Check the checkboxes next to the counters you want displayed in
the traffic graph.
* Note: A maximum of 9 counters can be displayed in the traffic
graph.
3. Click
Apply
. The selected counters appear under the traffic graph.
4. Check the variables you want displayed. Statistics for the checked
variables are displayed as line graphs.
SMON continuously monitors statistics for all available Extended Port
Statistics traffic variables, even those that are not currently selected. For
information on finding the 5 highest peaks of traffic, refer to Appendix A,
Using the Find Top5 Peaks Dialog Box
.
The following table lists the counters available for display in the Extended
Port Statistics traffic graph.
Table 5-3. Traffic Graph Counters in
Extended Port Statistics
Variable Description
Good Unicasts
Pkts In
The number of unicast packets entering the port. On
most networks, the unicast packets should constitute
the vast majority of the pie graph. If non-unicast
packets begin to increase, this indicates there may be a
problem.
Good Bcasts/
Mcasts On
Segment
The number of non-unicast packets on the port
segment.


