100 Hardware Overview
Power Consumption for N2000 Series PoE Switches
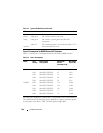
Table 3-5 shows power consumption data for the PoE-enabled switches.
The PoE power budget for each interface is controlled by the switch firmware.
The administrator can limit the power supplied on a port or prioritize power
to some ports over others. Table 3-6 shows power budget data.
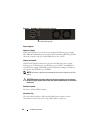
Stack
master
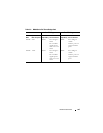
Off The switch is in stand-alone mode.
Solid green The switch is master for the stack.
Temp Solid green The switch is operating below the threshold
temperature.
Solid red The switch temperature exceeds the threshold of 75°C.
Stack No. – Switch ID within the stack.
Table 3-5. Power Consumption
Model Input
Voltage
Power Supply
Configuration
Max Steady
Current
Consumption (A)
Max Steady
Power (W)
N2024P 100V Main PSU+EPS PSU 8.9 890.0
110V Main PSU+EPS PSU 8.3 913.0
120V Main PSU+EPS PSU 7.6 912.0
220V Main PSU+EPS PSU 4.0 880.0
240V Main PSU+EPS PSU 3.6 873.6
N2048P 100V Main PSU+EPS PSU 17.8 1780.0
110V Main PSU+EPS PSU 15.8 1740.2
120V Main PSU+EPS PSU 14.5 1740.0
220V Main PSU+EPS PSU 7.7 1687.4
240V Main PSU+EPS PSU 7.1 1704.0
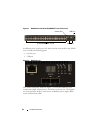
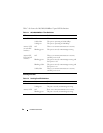
Table 3-4. System LED Definitions (Continued)
LED Color Definition


