Monitoring Switch Traffic 443
Viewing Statistics
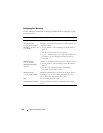
Use the following commands in Privileged EXEC mode to view statistics
about the traffic handled by the switch.
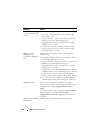
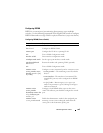
rmon collection history
index
[owner
ownername
] [buckets
bucket-number
]
[interval
seconds
]
Enable an RMON MIB history statistics group on the
interface.
NOTE: You must configure RMON alarms and events before
RMON collection history is able to display.
•
index
— The requested statistics index group. (Range:
1–65535)
•
ownername
— Records the RMON statistics group owner
name. If unspecified, the name is an empty string.
•
bucket-number
— A value associated with the number of
buckets specified for the RMON collection history group
of statistics. If unspecified, defaults to 50.
(Range: 1 - 65535)
•
s
econds
— The number of seconds in each polling cycle.
If unspecified, defaults to 1800. (Range: 1–3600)
CTRL + Z Exit to Privileged EXEC mode.
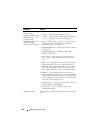
show rmon {alarms
|collection history |
events | history | log |
statistics}
View information collected by the RMON probe.
Command Purpose
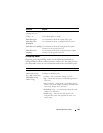
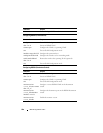
show interfaces counters
[errors][{
interface
|
port-channel
}]
Display the error counters or number of octets and packets
handled by all interfaces or the specified interface.
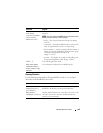
show statistics
{switchport |
interface
}
Display detailed statistics for a specific port or LAG, or for
the entire switch. The
interface
variable includes the
interface type and number.
Command Purpose


