


Monitoring Tools 12-1
CC
CC
hh
hh
aa
aa
pp
pp
tt
tt
ee
ee
rr
rr
11
11
22
22
MM
MM
oo
oo
nn
nn
ii
ii
tt
tt
oo
oo
rr
rr
ii
ii
nn
nn
gg
gg
TT
TT
oo
oo
oo
oo
ll
ll
ss
ss
This chapter discusses the Netopia R9100’s device and network monitoring tools. These tools can provide
statistical information, report on current network status, record events, and help in diagnosing and locating
problems.
This section covers the following topics:
■ “Quick View status overview” on page 12-1
■ “Statistics & Logs” on page 12-3
■ “Event histories” on page 12-5
■ “Routing tables” on page 12-7
■ “Served IP Addresses” on page 12-10
■ “System Information” on page 12-12
■ “SNMP” on page 12-12
■ “SmartView” on page 12-16
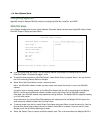
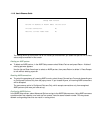
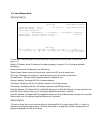
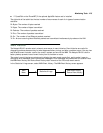
Quick View status overview
You can get a useful, overall status report from the Netopia R9100 in the Quick View screen. To go to the Quick
View screen, select Quick View in the Main Menu.
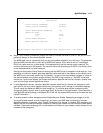
The Quick View screen has three status sections:
■ General status
■ Current WAN Connection Status
■ LED Status
The status sections vary according to the interface of your Netopia R9100.
Main
Menu
Quick View