


$
$$
$
33/,&$7,216
33/,&$7,21633/,&$7,216
33/,&$7,216
For clarification and further technical assistance specific to your application, please contact
Lambda EMI.
'(
'('(
'(7
77
7(50,1,1*&
(50,1,1*&(50,1,1*&
(50,1,1*&$3$&,725&
$3$&,725&$3$&,725&
$3$&,725&+$5*(7
+$5*(7+$5*(7
+$5*(7,0(
,0(,0(
,0(
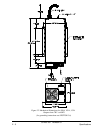
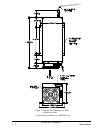
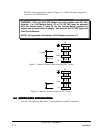
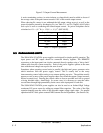
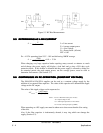
The ratings of these supplies are as follows: 500A - 500 J/s, 102A - 1000 J/s, 152A -
1500J/s, 202A-2000J/s average charge rate. Although the measure of Joules/sec equates to
Watts, Stored Energy per unit time is more convenient when working with energy storage
capacitors. The peak charge rate determines the capacitor charge time. The average charge
rate determines the total power delivered from the power supply. It is possible to charge a
capacitor at 1650 J/sec, but to discharge it at a low rep. rate producing an average of 100
J/sec. The following formulas can be used to determine the average and peak charge rate.
Peak Charge Rate = C - OUTPUT LOAD CAPACITOR
1
2
CV
2
T
C
V - PROGRAMMED OUTPUT VOLTAGE
Average Charge Rate =
T
C
AND T
P
ARE SHOWN IN FIGURE
1
2
CV
2
T
p
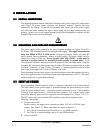
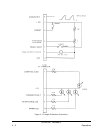
V OL TA G E
T I M E
T c T p
Figure 5.1 Output Voltage Waveform
9
99
92/7$*(5
2/7$*(52/7$*(5
2/7$*(5(9(56$/
(9(56$/(9(56$/
(9(56$/
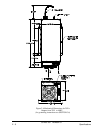
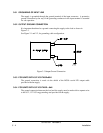
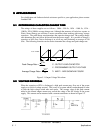
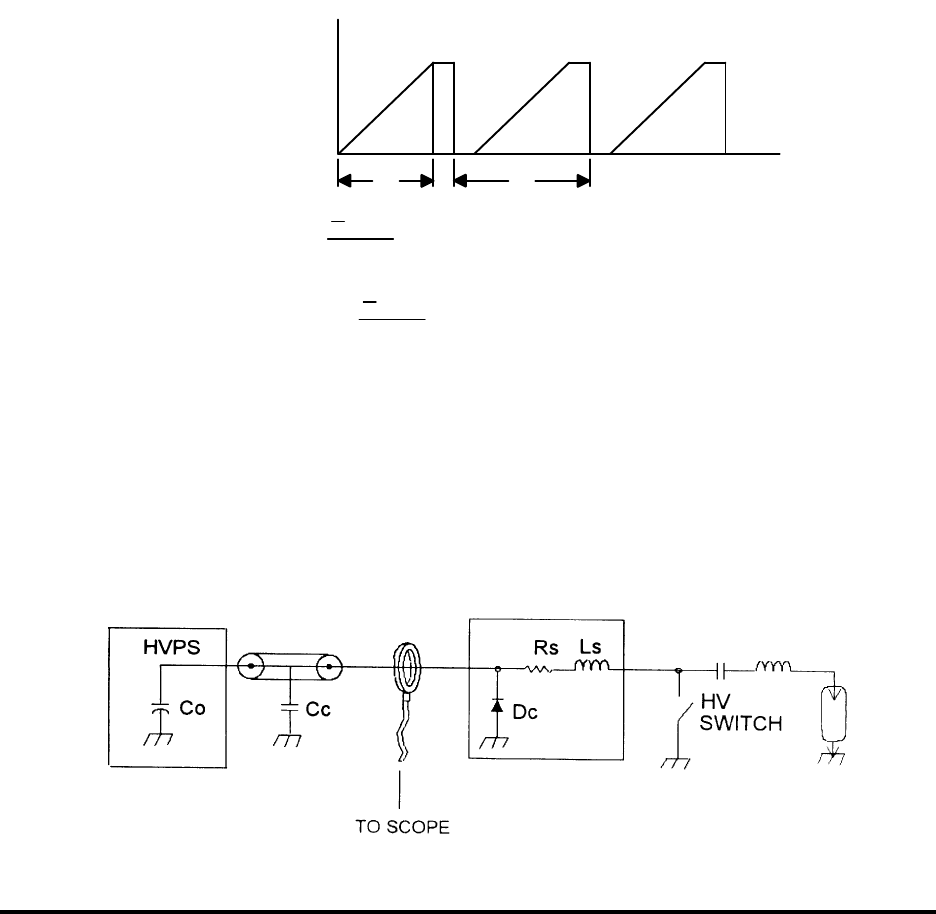
When the capacitor or PFN is discharged, a high peak current may flow out of the power
supply as a result of voltage reversal. This occurs in a system which is underdamped in order
to clear the high voltage switch after each pulse. The average value of this peak current
added to the normal output current may exceed the rating of the HV diodes in the power
supply. This current can be measured with a current transformer as shown in Figure 5.2.
83-493-001 Revision G
5 - 1 Applications