3-13
Using the HP Web Browser Interface
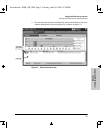
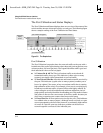
The Web Browser Interface Screen Layout
Using the HP Web Browser
Interface
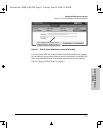
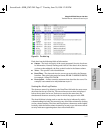
■ Tab Bar. The row of tabs displaying all the Browser Interface Top Level
menus.
■ Active Tab. The current tab selected. The tab is darkened and all the
buttons under the tab are displayed.
■ Status Bar. The region above the Tab Bar that displays status and device
name information.
■
Port Utilization and Status Displays. The region containing graphs
that indicate network traffic on each switch port and symbols indicating
the status of each port.
■ Button Bar. The row(s) of buttons that are contained within the Active
Tab.
■ Active Button. The current button selected. The button is darkened and
the window associated with the button is displayed.
■ Alert Log. A list of all events, or alerts, that can be retrieved from the
switch’s firmware at the current time. Information associated with the
alerts is displayed, including Status, Alert Name, the date and time the
Alert was reported by the switch, and a short description of the alert. You
can double click on any of the entries in the log and get a detailed
description. See “The Alert Log” on page 3-16.
■ Alert Log Header Bar. The row of column heads running across the top
of the Alert Log.
■
Alert Log Control Bar. The region at the bottom of the Alert Log
containing buttons that enable you to refresh the Alert Log to display all
alerts that have been reported since you first displayed the log. Also
available in the bar are a button to acknowledge new alerts and a button
to delete alerts.
Sraswb.book : SIER_SW3.FM Page 13 Tuesday, June 30, 1998 12:20 PM


