


Using the HP Web Browser Interface
Status Reporting Features
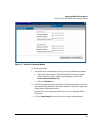
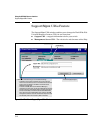
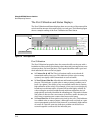
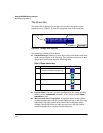
The Port Utilization and Status Displays
The Port Utilization and Status displays show an overview of the status of the
switch and the amount of network activity on each port. The following figure
shows a sample reading of the Port Utilization and Port Status.
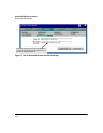
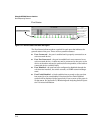
Port Status Indicators
Port Utilization Bar Graphs
Bandwidth Display Control
Legend
Figure 5-9. The Graphs Area
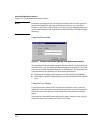
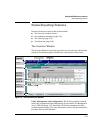
Port Utilization
The Port Utilization bar graphs show the network traffic on the port with a
breakdown of the packet types that have been detected (unicast packets, non-
unicast packets, and error packets). The Legend identifies traffic types and
their associated colors on the bar graph:
■ % Unicast Rx & All Tx: This is all unicast traffic received and all
transmitted traffic of any type. This indicator (a blue color on many
systems) can signify either transmitted or received traffic.
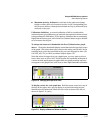
■ % Non-Unicast Pkts Rx: All multicast and broadcast traffic received by
the port. This indicator (a gold color on many systems) enables you to
know “at-a-glance” the source of any non-unicast traffic that is causing
high utilization of the switch. For example, if one port is receiving heavy
broadcast or multicast traffic, all ports will become highly utilized. By
color-coding the received broadcast and multicast utilization, the bar
graph quickly and easily identifies the offending port. This makes it faster
and easier to discover the exact source of the heavy traffic because you
don’t have to examine port counter data from several ports.
■ % Error Pkts Rx: All error packets received by the port. (This indicator
is a reddish color on many systems.) Although errors received on a port
are not propagated to the rest of the network, a consistently high number
of errors on a specific port may indicate a problem on the device or
network segment connected to the indicated port.
5-16