


Example 1: Building and Running an Application
1-8 Getting Started with ADSP-BF548 EZ-KIT Lite
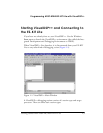
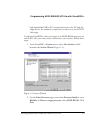
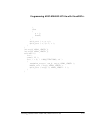
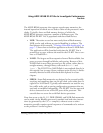
Repeat this procedure to create a plot window for the
out_m variable
1
,
modifying steps 2 and 3 accordingly. Once the plot windows are created,
adjust them to comfortable sizes. Your plot windows look similar to those
in Figure 1-3.
Note that both line plots are flat at zero because the data arrays are
zero-initialized by VisualDSP++. We will see VisualDSP++ update the
windows as we step into the program. Issue the Debug–>Step Over com-
mand (or use the F10 hotkey) three times to highlight the call to the
bubble_sort() function as the next statement to execute. The two plot
windows show the random values to which the arrays are initialized.
Step Over again to observe that the out_b array is now sorted. Step Over
one more time to observe that out_m is also sorted.
Note that the example 1 project uses the debug configuration. The debug
configuration is one of the two configurations VisualDSP++ provides for
projects. You can create more configurations. A configuration is a set of
project build options, similar in concept to a makefile target. It is often
desirable to maintain different types of configurations for your system.
For example, while debugging you may want to include trace or other
1
You can add both plots to a single window. However, this is undesirable when two plots have the same
results, causing the plot lines to overwrite each other.
Figure 1-3. Plot Windows