


Getting Started with ADSP-BF548 EZ-KIT Lite 2-5
Using ADSP-BF548 EZ-KIT Lite to Investigate Performance
Factors
and associated EZ-KIT Lite devices. Another library function (
clock())
provides the current value of the processor’s core clock cycle counter
whenever the function is called.
Since we are examining performance in this example, we will build the
project in the Release configuration, which invokes the compiler’s opti-
mizer. Ensure that the configuration drop-down list in the project toolbar
is set to Release rather than Debug, then rebuild the project.
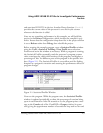
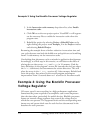
Before running the example program, open a Statistical Profiler window
using the Tools–>Statistical Profiling–>New Profile menu selection.
Position and resize the window as necessary. While a program is running,
the Statistical Profiler repeatedly reads the processor’s program counter
value, associates the values with locations in the program, and displays a
percentage of ‘hits’ for different parts of the program in the profiler win-
dow (Figure 2-1). The Statistical Profiler is an excellent tool for finding
hotspots in a program’s execution and assessing the performance effects of
program changes.
Now run the program. While the program runs, the Statistical Profiler
window is updated periodically to show the percentage of runtime being
spent in each function. After 20 seconds or so, the program prints a mes-
sage to the Console tab of the VisualDSP++ Output window (in green
text) giving the approximate number of seconds the loop took to run and
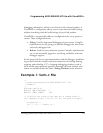
Figure 2-1. Statistical Profiler Window