


Example 2: Benchmarking the Relative Performance of
Memories
2-6 Getting Started with ADSP-BF548 EZ-KIT Lite
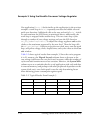
the approximate number of millions of processor cycles executed (see
Table 2-1). The first row in Table 2-1 shows typical values, along with the
Statistical Profiler’s final estimates of the percentage of execution time
spent in the
bubble_sort() and quick_sort() functions. Your figures may
differ slightly from those in Table 2-1 but still will show that, as expected,
bubble_sort() is using most of the processor time.
By default, VisualDSP++ maps as much code and data as possible to inter-
nal L1 and L2 memories when building a program. However, this
project’s options contain a setting that maps all of the code and data from
Sorts.c into external memory, and so the just obtained profiling results
represent the worst-case performance for our application. In the following
sections, we will modify the placement of some parts of the program and
observe the effects.
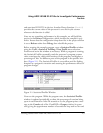
One way to alter the default placement of an individual code function or
data variable is to place a section directive in front of its definition in the
C source file. This directive causes the VisualDSP++ compiler to place the
item in the output section named in the directive. The available section
names are defined in the linker description (.ldf) file that the project
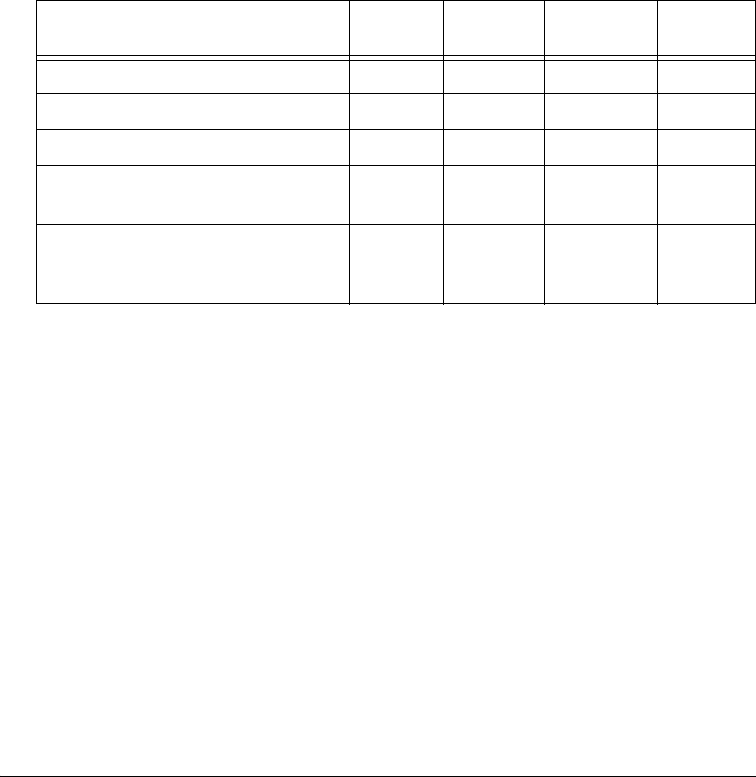
Table 2-1. Typical Results from Example 2
Code and Data Disposition Elapsed
Seconds
Core
Cycles
Bubble Sort
%
Quick Sort
%
Everything in external memory 19 9533 74 23
bubble_sort() in L2 memory 13 7079 66 30
bubble_sort() in L1 code memory 13 6866 64 32
Everything in external memory, plus
code cache on
10 5367 87 11
All code in external memory, plus code
cache on, plus data arrays in L1 data
memory
1 612 68 25