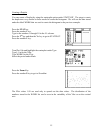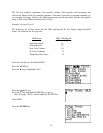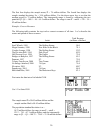
The last five numbers (minimum, first quartile, median, third quartile, and maximum) are
collectively known as the five-number summary of the data. From the five-number-summary we
can compute the range, which is the difference between maxX and minX, and the interquartile
range, which is the difference between Q3 and Q1.
Example: Average Payroll
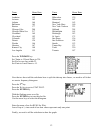
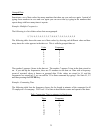
The following list of data values lists the 2002 total payroll for five Major League Baseball
teams. Let’s analyze the five payrolls.
MLB Team
2002 Total Payroll
(millions of dollars)
Anaheim Angels 62
Atlanta Braves 93
New York Yankees 126
St. Louis Cardinals 75
Tampa Bay Devil Rays 34
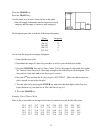
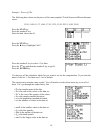
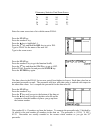
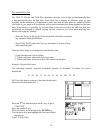
First store the data as a list labeled MLB.
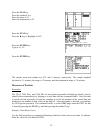
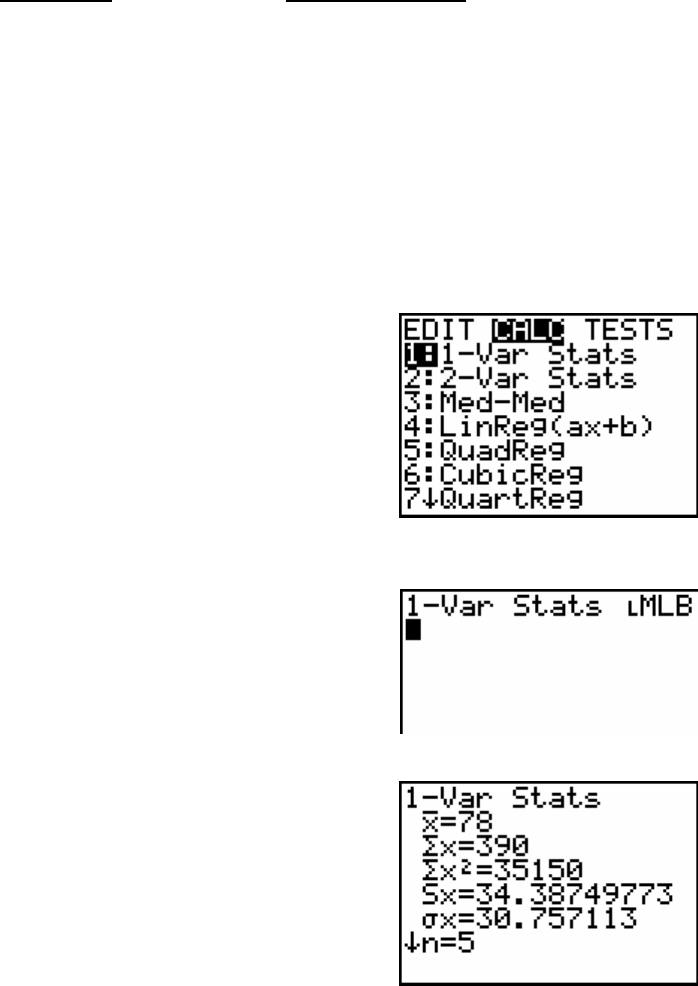
Press the STAT key.
Press the ► key to highlight CALC.
Press the number 1 key.
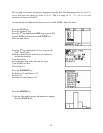
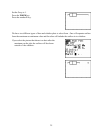
Press the 2
nd
key and then the STAT key to get to
the LIST page. MLB is stored under the NAMES list.
Select MLB
Press the ENTER key.
19


