Chapter
9
Hypothesis Tests About the
Mean and Proportion
Hypothesis Tests About Means
Hypothesis tests about means can be Z-based (if σ is known) or T-based (if σ is unknown and
either the population is normal or the sample size is over 30). The TI-83, TI-83 Plus, and the TI-
84 Plus calculators provide functions for both the Z-Test and the T-Test. They both provide a p-
value for comparison with the test’s significance level. Since σ is rarely known, we will use the
T-Test to perform our tests of significance. The T-Test is located on the STAT page in the Tests
list.
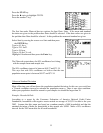
The menu for T-Test is very similar to the one for TInterval described in the last chapter. Again
you have a choice between working with the data or the summary statistics. The T-Test requires
you to enter the null hypothesis, the sample mean, and which alternative hypothesis you are
using.
Example: Mean Salary
According to a salary survey by the National Association of Colleges and Employers, the
average salary offered to computer science majors who graduated in May 2002 was $50,352.
Suppose this result is true for all computer science majors who graduated in May 2002. A
random sample of 200 computer science majors who graduated this year showed they were
offered a mean salary of $51,750 with a standard deviation of $5240. Using a 1% significance
level, can you conclude that the mean salary of this year’s computer science graduates is higher
than $50,352? The null hypotheses is H
0
: µ = 50,352 and the alternative hypothesis is H
1
: µ >
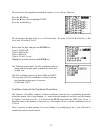
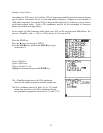
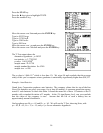
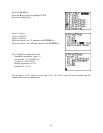
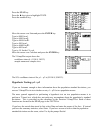
50,352. We will use the T-Test, choosing Stats, with µ
0
= 50,352, Ë = 51,750, s
x
= 5240, n = 200,
and µ
1
> µ
0
for our alternative hypothesis.
55


