Chapter
8
Estimation of the Mean
and Proportion
In statistics we collect samples to find things out about a population. If the sample is
representative of the population, the sample mean or proportion should be statistically close to
the actual population mean or proportion. A way to judge how close the sample statistic may be
is to create a confidence interval. This chapter will describe how to use the calculator to
compute confidence intervals for population means and proportions.
Confidence Intervals for Population Means
There are two functions used to compute confidence intervals for the population mean µ:
ZInterval for when σ is known, and TInterval for when σ is unknown. Both are found on the
STAT page and under the TESTS list.
Known Standard Deviation
If you are fortunate enough to know the population standard deviation σ, either from theory or
from a pilot study, then you would use a Z-based confidence interval to estimate the population
mean µ.
Example: Textbook Price
A publishing company has just published a new college textbook. Before the company decides
the price at which to sell this textbook, it wants to know the average price of all such textbooks
in the market. The research department at the company took a sample of 36 such textbooks and
collected information on their prices. This information produced a mean of $70.50 for this
sample. It is known that the standard deviation of the prices of all such textbooks is $4.50.
Construct a 90% confidence interval for the mean price of all such college textbooks.
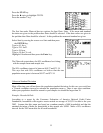
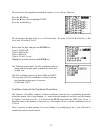
We have the population standard deviation σ, so we will use ZInterval. We do not have the data
itself, so we will select Stats where it asks for input. We enter 4.5 for σ, 70.5 for Ë, 36 for n, and
.90 for C-Level.
50


