


107
Chapter 6: Advanced Graphing Features — Advanced Keyboard
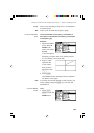
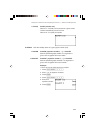
6 Draw Draw
equation
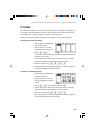
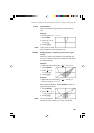
Draws an additional graph based on a given expres-
sion.
Example
•Draw the graph of y = 3x
2
-4x+2.
1. Select Draw.
2. Enter “3x
2
–4x+2”
on the line.
3. Press E.
Note: This tool can be used
with rectangular coordinate graphs only.
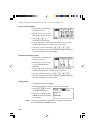
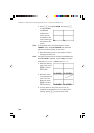
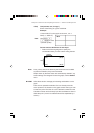
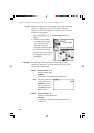
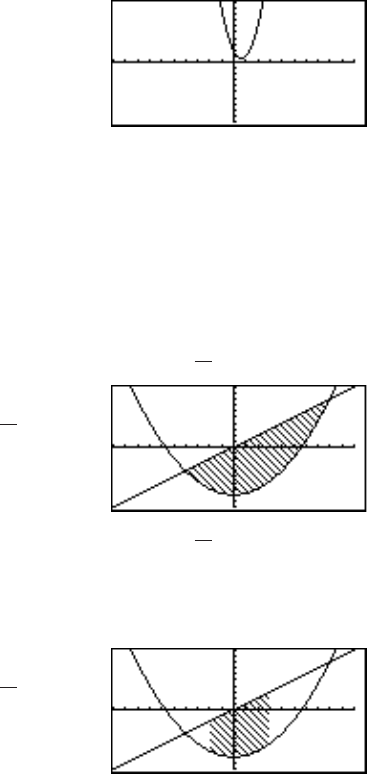
7 Shade( Shade(
equation1, equation2 [, lower value, upper
value]
)
Draws two graphs, and shades the area between the
two. If the x range is specified, it shades the area within
the specified range.
Example
• Shade the area enclosed by y =
1
4
x
2
– 8 and y = x.
1. Select Shade(.
2. Enter “
1
4
x
2
– 8,
x)” on the line.
3. Press E.
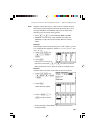
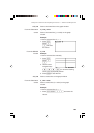
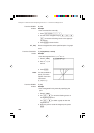
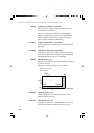
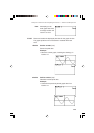
Example
• Shade the area enclosed by y =
1
4
x
2
– 8 and y = x
within the range of –2 ≤ x ≤ 3.
Before starting operation, Select ClrDraw to clear the
graphs previously drawn.
1. Select Shade(.
2. Enter “
1
4
x
2
– 8, x,
-2, 3)” on the line.
3. Press E.
Note: It is also possible to
specify a function equation from Y0 to Y9 if stored.