


65
Chapter 4: Basic Graphing Features — Basic Keyboard
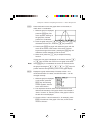
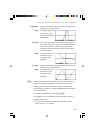
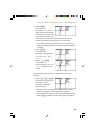
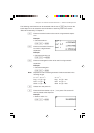
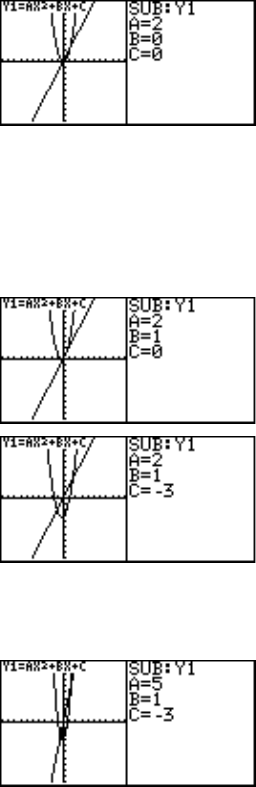
2. Press 2 E.
(2 is input to A.)
The graph for “Y1 = 2X
2
” is
drawn. (Since B and C have
no values, they are ignored.)
At this time, the graph for Y2
is also drawn. Y2 also uses variable A which is used in Y1.
Therefore, the drawing of the graph for Y2 is also valid.
* If you need to draw only the graph for Y2, it is necessary to
change variables (characters) or make the graph drawing for
Y1 invalid.
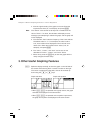
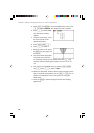
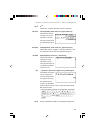
3. Press 1 E.
(1 is input to B.)
The graph is changed from
“Y1 = 2X
2
” to “Y1 = 2X
2
+
1X”.
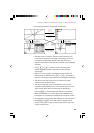
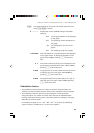
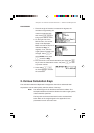
4. Press _ 3 E.
(
-3 is input to C.)
Now, the graph for “Y1 = 2X
2
+ 1X – 3” is drawn on the
screen.
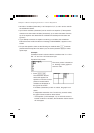
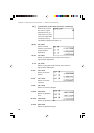
Next, change variable A from 2 to 5 and see how the graph
changes.
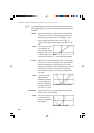
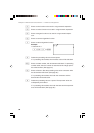
1. Press { { 5 E.
(The cursor is moved from C
to A and 5 is input.)
The slope of the graph
becomes sharp.
*Move the cursor accordingly and substitute other numeric
values for variables to view how the graph changes.
* The trace function cannot be used in the substitution feature.
(When U is pressed, the full-screen graph will appear.)