


168
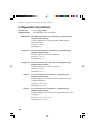
Chapter 10: Statistics & Regression Calculations
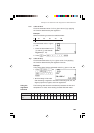
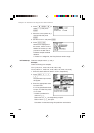
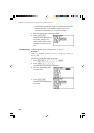
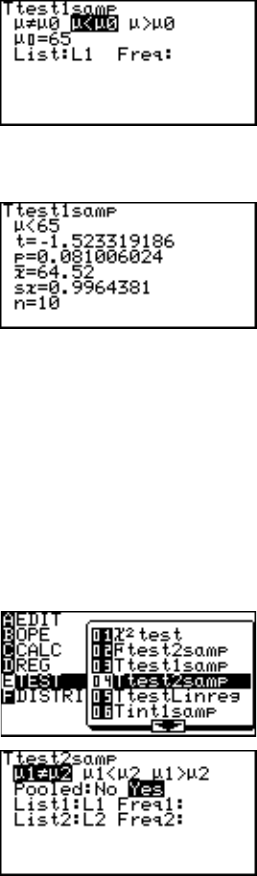
3. Press ' E } to
select µ < µ
0
and press
E.
4. Move the cursor pointer to µ
0
and input 65 and press
E.
5. Set the List to L1 and press E.
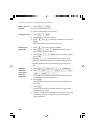
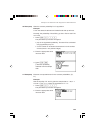
6. Press @ h.
Answers are displayed on
the screen, where t is the t
statistic for the test, p is the
p value for the test and sx
indicates sample standard
deviation.
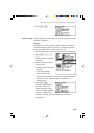
• If there is no weight list, the Freq field can remain empty.
04 Ttest2samp Tests two sample means, µ
1
and µ
2
.
Example
Test the following two samples;
List 1 {2.37, 2.51, 2.43, 2.28, 2.46, 2.55, 2.49}
List 2 {2.63, 2.71, 2.56, 2.61, 2.55, 2.68, 2.42, 2.48, 2.51, 2.65}
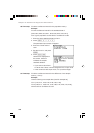
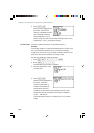
1. Enter the above data into lists L1 and L2, respectively.
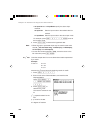
2. Press S E 0
4.
The parameter input screen
will appear.
3. Enter the appropriate value
into each field.
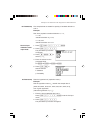
If no Freq specification data
is input, an initial Freq value
of 1 is used.
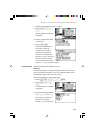
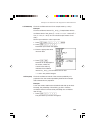
*Pooled is prediction for
unknown σ
1
, σ
2
.
Select “No” if σ
1
, σ
2
, are subjectively unequal.
Select “Yes” if σ
1
, σ
2
, are equal.
Calculation is executed using this prediction as the basis.