


147
Chapter 10: Statistics & Regression Calculations
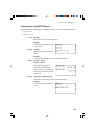
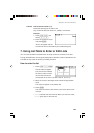
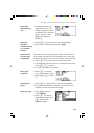
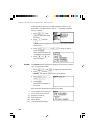
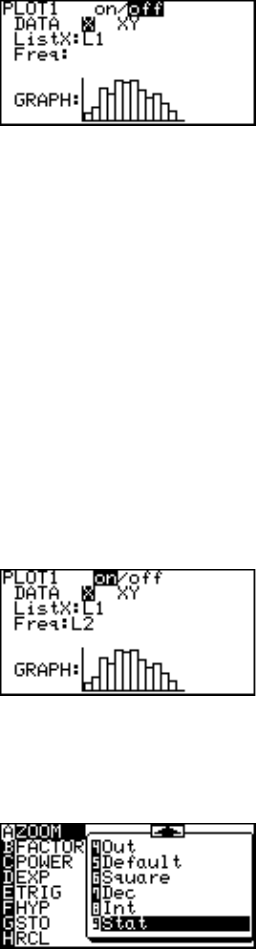
3. The first line shows if the
graph drawing is on or off.
Initially, the graph drawing is
off. With the cursor pointer at
the “on” position, press
E to set the graph
drawing on.
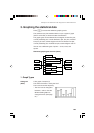
4. Press } to move the cursor to the next line (DATA).
5. Select X for 1-variable plotting and press E.
Determining ListX and Freq Frequency relates to the number of
times access occurred (L2) at the ListX stage. You can refer that
the Access of ListX (L1) hour occurred Freq (L2) number of times.
6. Press } to move the cursor to the next line (ListX).
7. The default list name for ListX is L1. If another list name is set,
press @ 1 to enter L1.
8. L1 is set to be used for x-axis items.
9. Press } to move the
cursor to the next line (Freq).
10
. Press @ 2 to enter
L2.
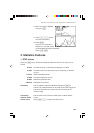
11
. Press } to move the cursor to the next line (GRAPH).
12
. The graph format defaults to histogram, so if that is what is
required, this does not need to be changed.
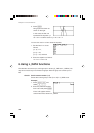
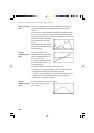
13
. Press Z, and then
select A ZOOM.
14
. Press ' to move the
cursor right and then press
} several times.
9 Stat will appear.
Setting the
graph drawing
“on”
Selecting
whether 1-
variable plotting
or 2-variable
plotting
Select the list
number used
for graphing
Setting the
frequency
Selecting the
graph
Making a graph