


156
Chapter 10: Statistics & Regression Calculations
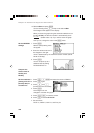
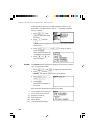
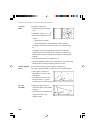
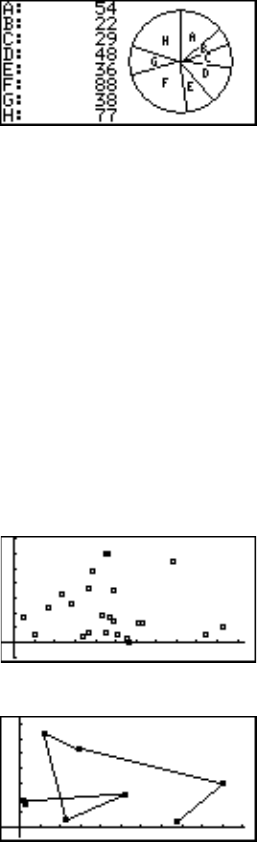
Pie graph of sample (x)
• Maximum number of division
is 8.
• Calculation range: 0 ≤ x < 10
100
• Data can be displayed in two
modes:
•Value display: 8 digits
•Percentage display: Fixed decimal (2 digits decimal)
* Pie graphs are drawn in the same order as on the specifying
list.
* Pie graphs cannot be displayed simultaneously with other
graphs and X/Y axis, though lines or dots can be drawn. The
coordinates of the free-moving cursor depend on the Window
settings.
• The values are stored in variables A to H.
• As all the displayed values are rounded down in the percentage
display mode, the total percentage may not be 100.
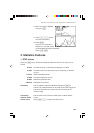
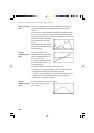
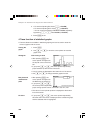
A two-dimensional plot graph using two samples (x, y)
Two sets of statistical data are required for the scatter diagram.
• Three types of points are
selectable from circle, cross
and square.
•Two statistical data lists can
be set to either x- or y-axis
according to your requirements.
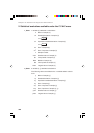
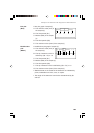
• Displays a graph that con-
nects each point of the scatter
diagram.
• Each point is connected in the
sequence (rows) of the
statistical data.
Pie chart
(PIE)
Scatter diagram
(S.D.)
XY Line
(XYLINE)