


155
Chapter 10: Statistics & Regression Calculations
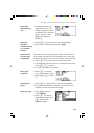
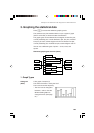
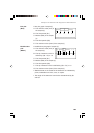
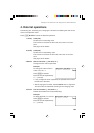
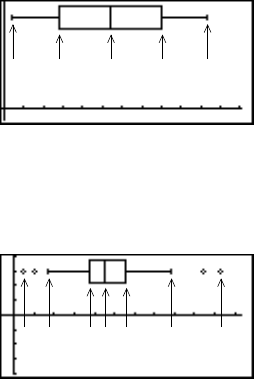
A box plot graph of sample (x)
A. The minimum value (xmin) of
the sample (x)
B. The first quartile (Q1)
C. Median (Med) of the sample
(x)
D. The third quartile (Q3)
E. The maximum value (xmax) of the sample (x)
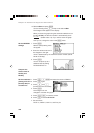
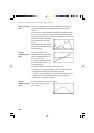
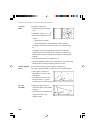
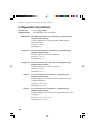
A modified box plot graph of sample (x)
A. The minimum value (xmin) of
the sample (x)
B. The tip of extension which is
defined by (Q3
– Q1) x 1.5
C. The first quartile (Q1)
D. Median (Med) of the sample (x)
E. The third quartile (Q3)
F. The tip of extension which is defined by (Q3 – Q1) x 1.5
G. The maximum value (xmax) of the sample (x)
• Statistical data on the outside of the extension are indicated by
points, selectable from circle, cross, or square.
• The length of the extension from the box is determined by Q1
and Q3.
A EB C D
A B CD E F G
Box plot
(Box)
Modified box
plot
(MBox)