


EL-9900 Graphing Calculator
Solving Inequalities
To solve an inequality, expressed by the form of f (x)
≤
0, f (x)
≥
0, or form of f (x)
≤
g(x),
f (x)
≥
g(x), means to find all values that make the inequality true.
There are two methods of finding these values for one-variable inequalities, using graphical
techniques. The first method involves rewriting the inequality so that the right-hand side of
the inequality is 0 and the left-hand side is a function of x. For example, to find the solution
to f (x) < 0, determine where the graph of f (x) is below the x-axis. The second method
involves graphing each side of the inequality as an individual function. For example, to find
the solution to f (x) < g(x), determine where the graph of f (x) is below the graph of g(x).
Solve an inequality in two methods.
Example
1.
Solve 3(4 - 2x)
≥
5 - x, by rewriting the right-hand side of the inequality as 0.
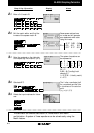
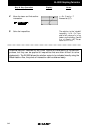
2.
Solve 3(4 - 2x)
≥
5 - x, by shading the solution region that makes the inequality true.
There may be differences in the results of calculations and graph plotting depending on the setting.
Return all settings to the default value and delete all data.
NotesStep & Key Operation Display
1-2
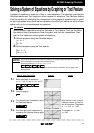
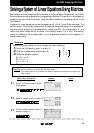
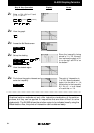
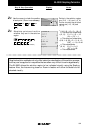
View the graph.
Find the location of the x-intercept
and solve the inequality.
1-3
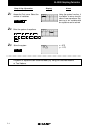
The x-intercept is located at
the point (1.4, 0).
Since the graph is above the
x-axis to the left of the x-in-
tercept, the solution to the in-
equality 3(4 - 2x) - 5 + x
≥
0 is
all values of x such that
x
≤
1.4.
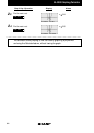
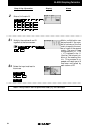
Rewrite the equation 3(4 - 2x)
≥
5 - x
so that the right-hand side becomes 0,
and enter y = 3(4 - 2x) - 5 + x for Y1.
3(4 - 2x) ≥ 5 - x
➞ 3(4 - 2x) - 5 + x ≥ 0
1-1
9-1
2nd F
CALC
5
3
4
2
5
Y=
()
—
—
+
GRAPH
Before
Starting
X/
/T/n
X/
/T/n