


EL-9900 Graphing Calculator
There may be differences in the results of calculations and graph plotting depending on the setting.
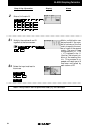
Return all settings to the default value and delete all data.
9-4
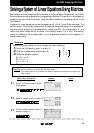
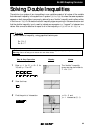
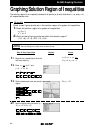
Graphing Solution Region of Inequalities
The solution region of an inequality consists of all points (a, b) such that when x = a, and y = b,
all inequalities are true.
Check to see if given points are in the solution region of a system of inequalities.
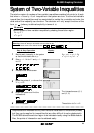
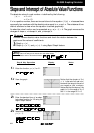
Example
1. Graph the solution region of a system of inequalities:
x + 2y
≤
1
x
2
+ y
≥
4
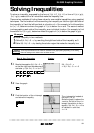
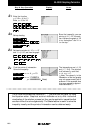
2. Which of the following points are within the solution region?
(-1.6, 1.8), (-2, -5), (2.8, -1.4), (-8,4)
1-1
Rewrite the inequalities so that the
left-hand side is y.
x + 2y
≤
1 ➞ y
≤
x
2
+y
≥
4 ➞ y
≥
4 - x
2
1-x
2
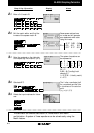
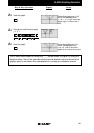
1-2
Enter y = for Y1 and
y = 4 - x
2
for Y2.
1-x
2
Set the shade and view the solution
region.
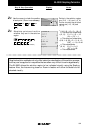
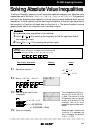
1-3
Y2
≤
y
≤
Y1
Set the display area (window) to :
-9 < x < 3, -6 < y < 5.
2-1
GRAPH
Y=
a
/b
1
2
4
G1
9
3
6
5
ENTER
ENTER
ENTERENTER
ENTER ENTER
WINDOW
(
-
)
(
-
)
—
—
2nd F
DRAW
Before
Starting
NotesStep & Key Operation Display
X/
/T/n
X/
/T/n
2nd F
2nd F
VARS
VARS
ENTER
ENTER
A
A2
1
GRAPH
x
2