


EL-9900 Graphing Calculator
12-1
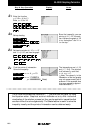
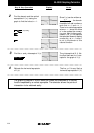
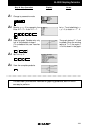
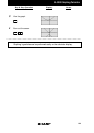
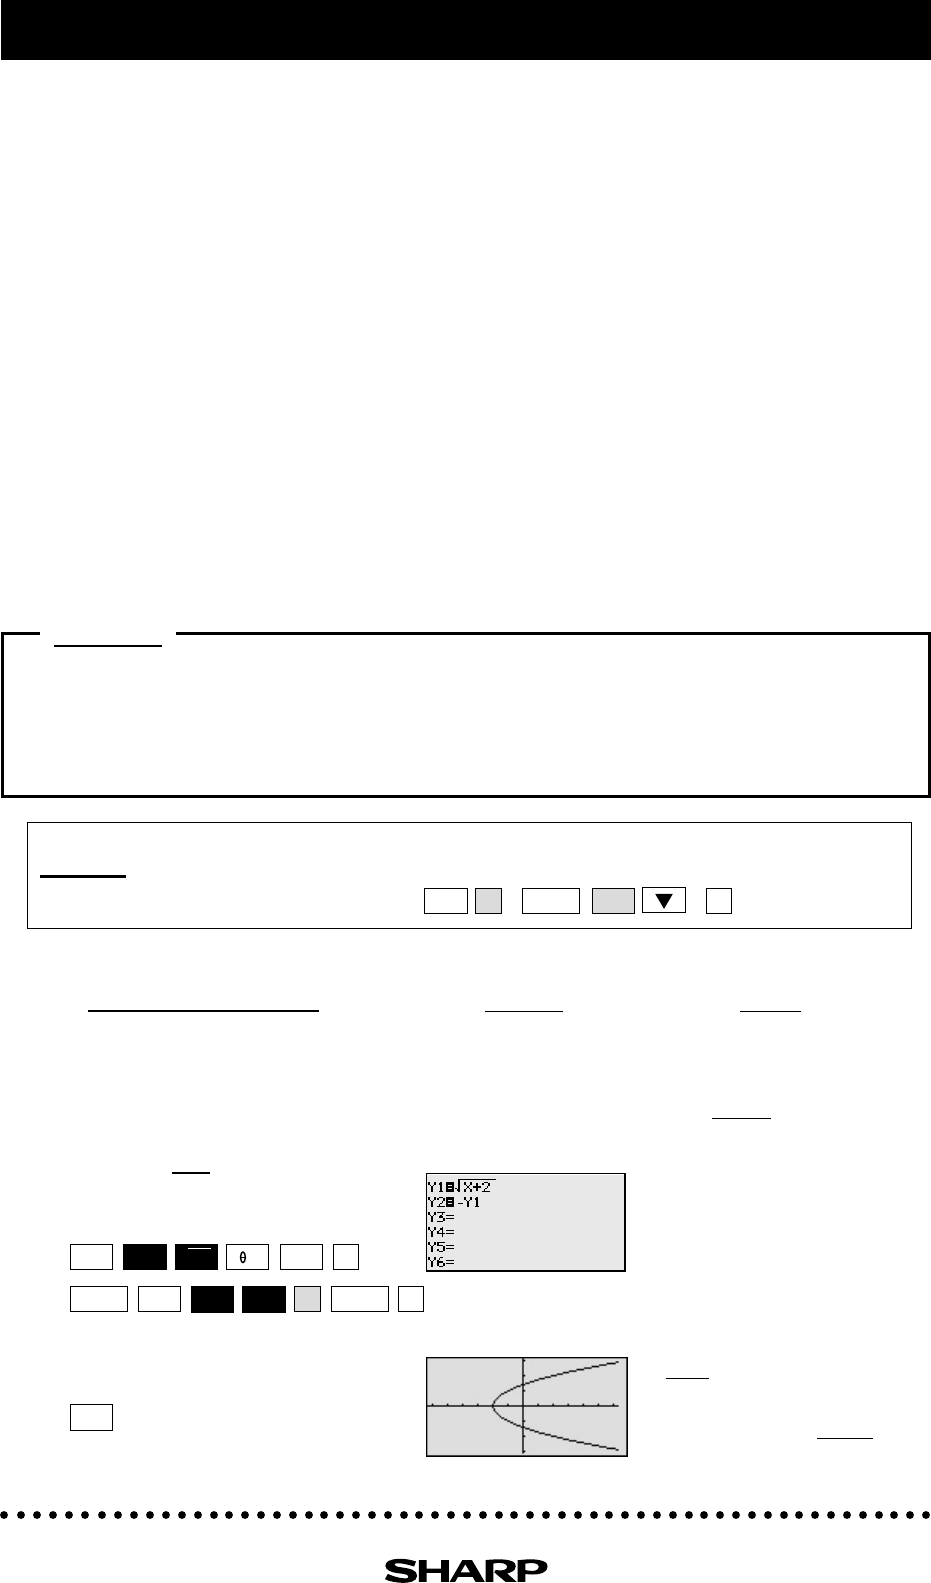
The graph of the equation y =
√
x+ 2 is the "top half" of the
parabola and the graph of the
equation y = -
√
x + 2 gives
the "bottom half."
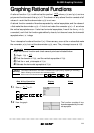
Graphing Parabolas
The graphs of quadratic equations (y = ax
2
+ bx + c) are called parabolas. Sometimes the quadratic
equation takes on the form of x = ay
2
+ by + c.
There is a problem entering this equation in the calculator graphing list for two reasons:
a) it is not a function, and only functions can be entered in the Y= list locations,
b) the functions entered in the Y= list must be in terms of x, not y.
There are, however, two methods you can use to draw the graph of a parabola.
Method 1: Consider the "top" and "bottom" halves of the parabola as two different parts of the graph
because each individually is a function. Solve the equation of the parabola for y and enter the two parts
(that individually are functions) in two locations of the Y= list.
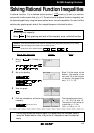
Method 2: Choose the parametric graphing mode of the calculator and enter the parametric equations
of the parabola. It is not necessary to algebraically solve the equation for y. Parametric representations
are equation pairs x = F(t), y = F(t) that have x and y each expressed in terms of a third parameter, t.
Graph a parabola using two methods.
Example
1. Graph the parabola x = y
2
-2 in rectangular mode.
2. Graph the parabola x = y
2
-2 in parametric mode.
1-1
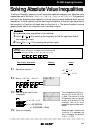
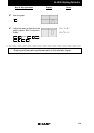
Solve the equation for y.
1-2
x = y
2
-2
x + 2 = y
2
y =
√
x + 2
Enter y =
√
x+2 for Y1 and enter
y = -Y1 for Y2.
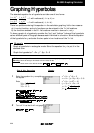
1-3
View the graph.
+
–
GRAPH
ENTER
ENTER
2
1
A(
-
)
Y= +
VARS
2nd F
√
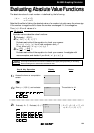
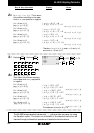
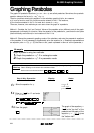
Before
Starting
There may be differences in the results of calculations and graph plotting depending on the setting.
Return all settings to the default value and delete all data.
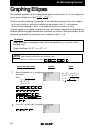
Set the zoom to the decimal window:
(
)
ENTER
A
ZOOM
7
ALPHA
Notes
Step & Key Operation
Display
2nd F
X/
/T/n