


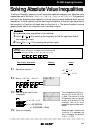
EL-9900 Graphing Calculator
NotesStep & Key Operation Display
2-1
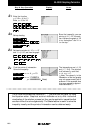
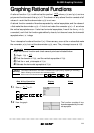
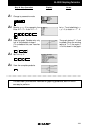
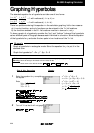
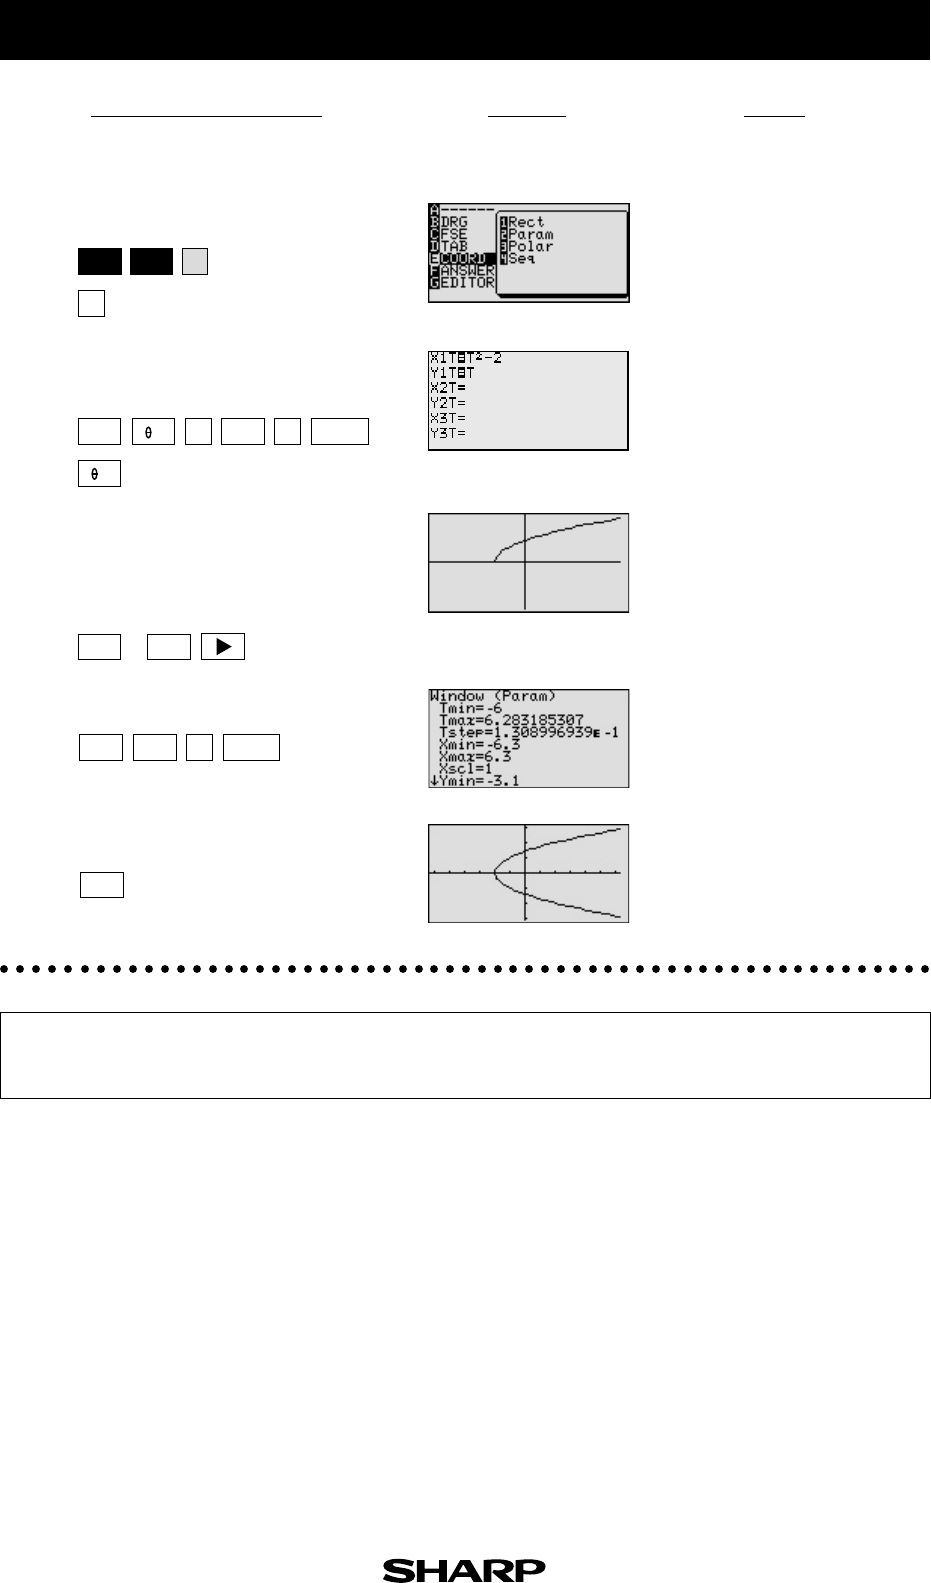
Change to parametric mode.
2-2
Rewrite x = y
2
-2 in parametric form.
Enter X1T = T
2
-2 and Y1T = T.
Let y = T and substitute in x
= y
2
- 2, to obtain x = T
2
- 2.
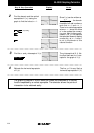
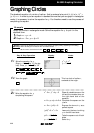
2-3
View the graph. Consider why only
half of the parabola is drawn.
(To understand this, use Trace fea-
ture.)
The graph starts at T =0 and
increases. Since the window
setting is T ≥ 0, the region T
< 0 is not drawn in the graph.
(
)
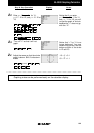
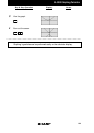
2-4
Set Tmin to -6.
2-5
View the complete parabola.
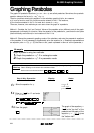
The calculator provides two methods for graphing parabolas, both of which
are easy to perform.
12-1
GRAPH
GRAPH
Y=
E
(
-
)
ENTER
WINDOW
TRACE
—
2
2
6
ENTER
2nd F
SET UP
X/
/T/n
x
2
X/
/T/n