


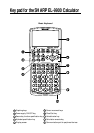


EL-9900 Graphing Calculator
12-4
Graph a hyperbola in rectangular mode. Solve the equation for y to put it in the
standard form.
Example
Graph the hyperbola x
2
+ 2x - y
2
- 6y + 3 = 0
Graphing Hyperbolas
The standard equation for a hyperbola can take one of two forms:
- = 1 with vertices at ( h
±
a, k ) or
- = 1 with vertices at ( h, k
±
b ).
There is a problem entering this equation in the calculator graphing list for two reasons:
a) it is not a function, and only functions can be entered in the Y= list locations.
b) the functions entered in the Y= list locations must be in terms of x, not y.
To draw a graph of a hyperbola, consider the “top” and “bottom” halves of the hyperbola
as two different parts of the graph because each individual is a function. Solve the equation
of the hyperbola for y and enter the two parts in two locations of the Y= list.
2
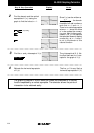
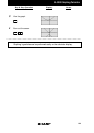
Turn off Y1 so that it will not graph.
1
Solve the equation for y completing
the square.
x
2
+ 2x - y
2
-6y = -3
x
2
+ 2x - (y
2
+ 6y + 9) = -3 -9
x
2
+ 2x - (y +3)
2
= -12
(y + 3)
2
= x
2
+ 2x + 12
y + 3 =
√
x
2
+ 2x + 12
y =
√
x
2
+ 2x + 12 - 3
( y - k )
2
b
2
( y - h)
2
a
2
( x - h )
2
a
2
( x - k )
2
b
2
+
+
ENTER
ENTER
ENTER
ENTER
ENTER
Y=
A
2
2nd F
A
1
2
1
3
1
3
(
-
)
+
—
VARS
+
VARS
—
Enter
Y1 =
√
x
2
+ 2x + 12
Y2 = Y1 -3
Y3 = -Y1 -3
√
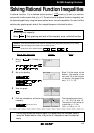
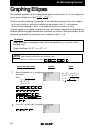
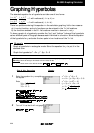
Before
Starting
There may be differences in the results of calculations and graph plotting depending on the setting.
Return all settings to the default value and delete all data.
Set the zoom to the decimal window:
(
)
ENTER
A
ZOOM
7
ALPHA
NotesStep & Key Operation Display
X/
/T/n
X/
/T/n
2nd F
2nd F
x
2