


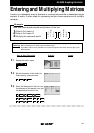
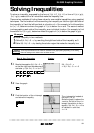
EL-9900 Graphing Calculator
There may be differences in the results of calculations and graph plotting depending on the setting.
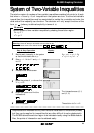
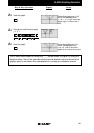
Return all settings to the default value and delete all data.
Set the zoom to the decimal window:
( )
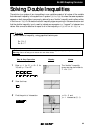
System of Two-Variable Inequalities
The solution region of a system of two-variable inequalities consists of all points (a, b) such
that when x = a and y = b, all inequalities in the system are true. To solve two-variable
inequalities, the inequalities must be manipulated to isolate the y variable and enter the
other side of the inequality as a function. The calculator will only accept functions of the
form y =
. (where y is defined explicitly in terms of x).
Example
Solve a system of two-variable inequalities by shading the solution region.
2x + y
≥
1
x
2
+ y
≤
1
9-3
5
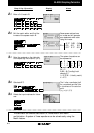
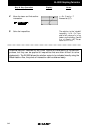
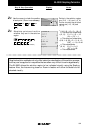
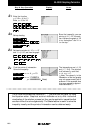
Graph the system and find the
intersections.
The intersections are (0, 1)
and (2, -3)
6 Solve the system.
The solution is 0
≤
x
≤
2.
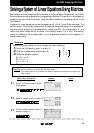
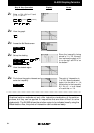
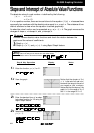
Graphical solution methods not only offer instructive visualization of the solution process,
but they can be applied to inequalities that are often difficult to solve algebraically.
The EL-9900 allows the solution region to be indicated visually using the Shade feature.
Also, the points of intersection can be obtained easily.
ZOOM
2nd F
A
ENTER
7
GRAPH
2
2
CALC
2nd F
CALC2nd F
Before
Starting
NotesStep & Key Operation Display
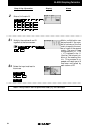
1
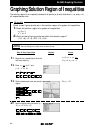
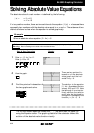
Rewrite each inequality in the system
so that the left-hand side is y :
2x + y
≥
1 ➞ y
≥
1 - 2x
x
2
+ y
≤
1 ➞ y
≤
1 - x
2
2
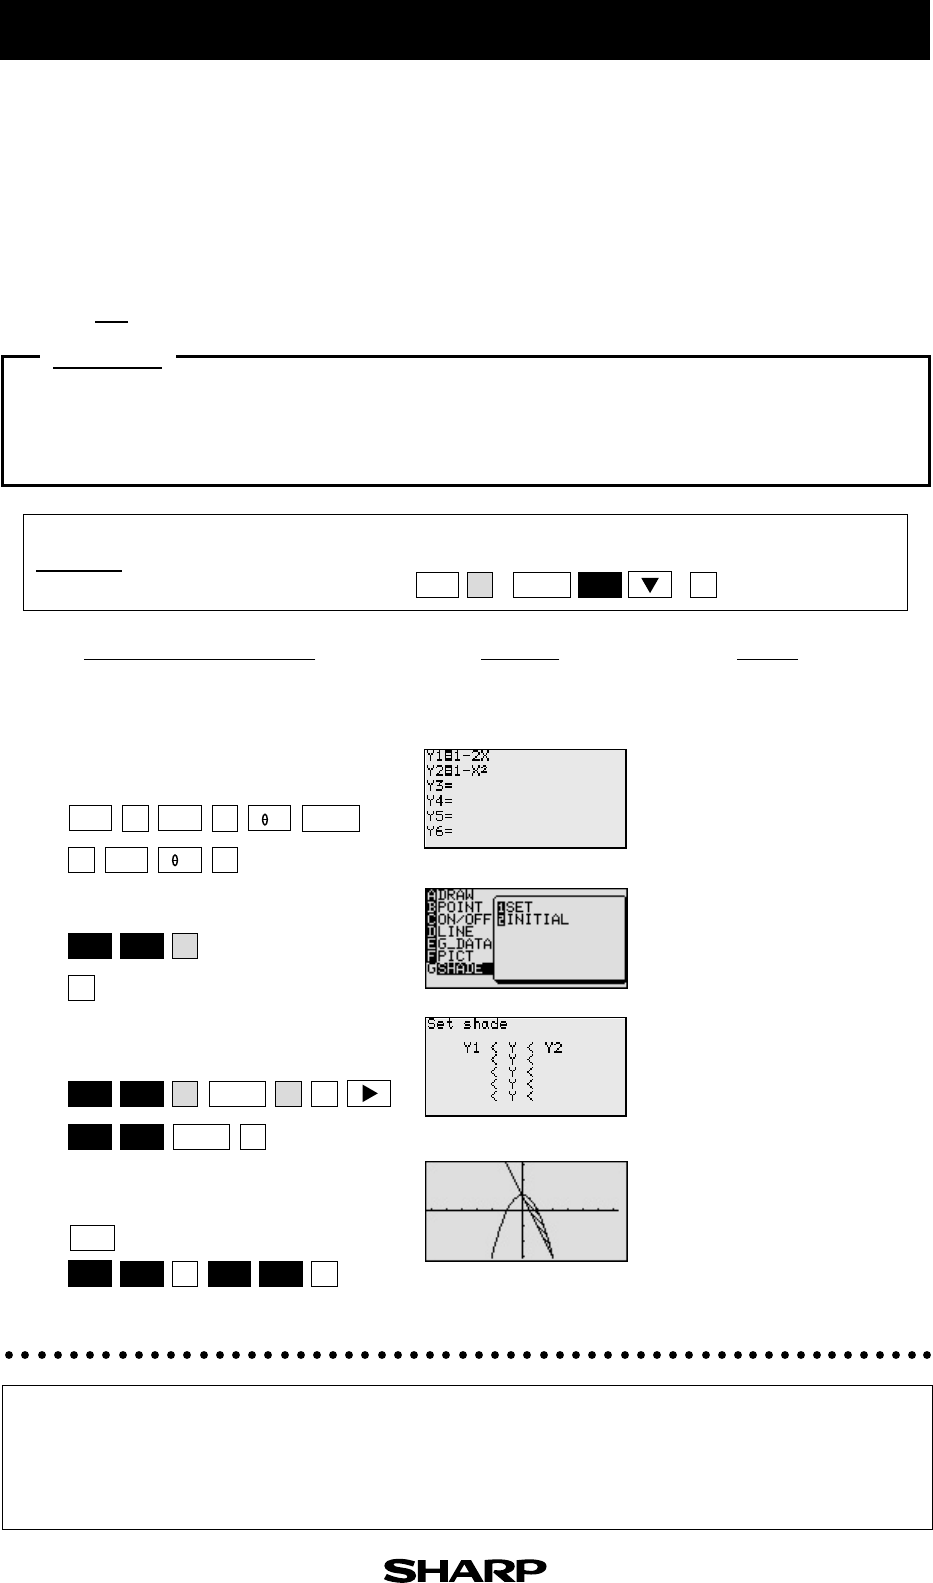
Enter y = 1 - 2x for Y1 and y = 1 - x
2
for Y2.
Y= 1 2
1
—
—
ENTER
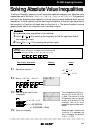
3
Access the set shade screen
G
1
2nd F
DRAW
4
Shade the points of y -value so that
Y1
≤
y
≤
Y2.
2nd F
2nd F
VARS
VARS
ENTER
ENTER
A
A
1
2
x
2
X/
/T/n
X/
/T/n