


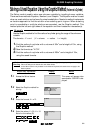

EL-9900 Graphing Calculator
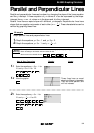
Slope and Intercept of Linear Equations
A linear equation of y in terms of x can be expressed by the slope-intercept form y = mx+b,
where m is the slope and b is the y - intercept. We call this equation a linear equation since its
graph is a straight line. Equations where the exponents on the x and y are 1 (implied) are
considered linear equations. In graphing linear equations on the calculator, we will let the x
variable be represented by the horizontal axis and let y be represented by the vertical axis.
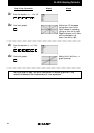
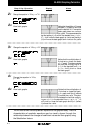
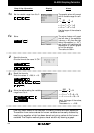
The equation Y1 = x is dis-
played first, followed by the
equation Y2 = 2x. Notice how
Y2 becomes steeper or climbs
faster. Increase the size of the
slope (m>1) to make the line
steeper.
Enter the equation y = x for Y1
and y = 2x for Y2.
View both graphs.
1-1
1-2
Enter the equation y = x for Y2.
View both graphs.
Notice how Y2 becomes less
steep or climbs slower. De-
crease the size of the slope
(0<m<1) to make the line less
steep.
2-1
2-2
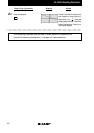
There may be differences in the results of calculations and graph plotting depending on the setting.
Return all settings to the default value and delete all data.
3-1
2
1
2
1
Y=
ENTER
2
Y= CL
1
a
/b
2
GRAPH
GRAPH
X/
/T/n
X/
/T/n
Before
Starting
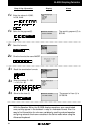
NotesStep & Key Operation Display
1. Graph the equations y = x and y = 2x.
2. Graph the equations y = x and y = x.
3. Graph the equations y = x and y = - x.
4. Graph the equations y = x and y = x + 2.
Draw graphs of two equations by changing the slope or the y- intercept.
Example
X/
/T/n