


AN93
Rev. 1.3 279
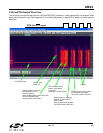
Audio Playback and Analysis
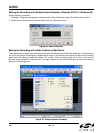
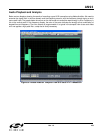
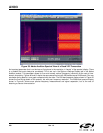
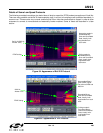
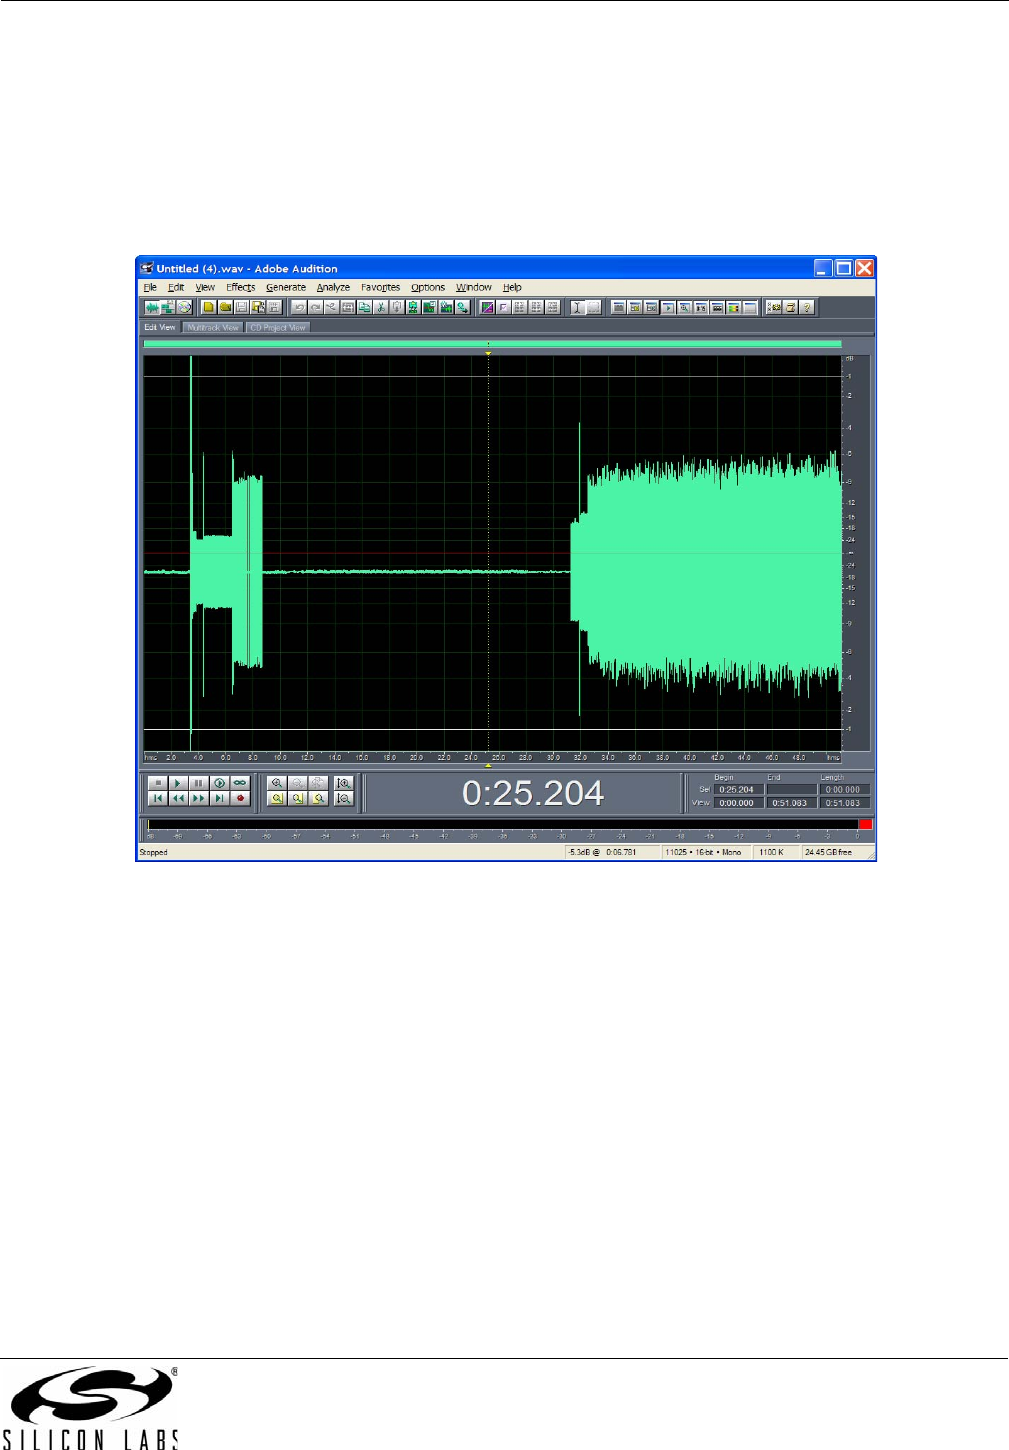
Below are two displays showing the results of recording a good V.22 transaction using Adobe Audition. We need to
examine the signal both in the time domain and the frequency domain, with the frequency domain being a much
more useful view. The graphs below show time on the horizontal axis and either wave energy in dB or Frequency in
Hz on the vertical scale. In the frequency display, the color of the wave indicates the energy at that combination of
elapsed time and frequency. The color scheme is programmable. It is typical in the temporal view to see a dc offset
until one applies a high-pass filter, a step that is rarely necessary.
Figure 58. Adobe Audition Temporal View of a Good V.22 Transaction