


Super Systems Inc. Page 26 SDS Data Logger Manual #4565 Rev D
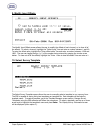
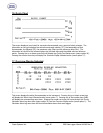
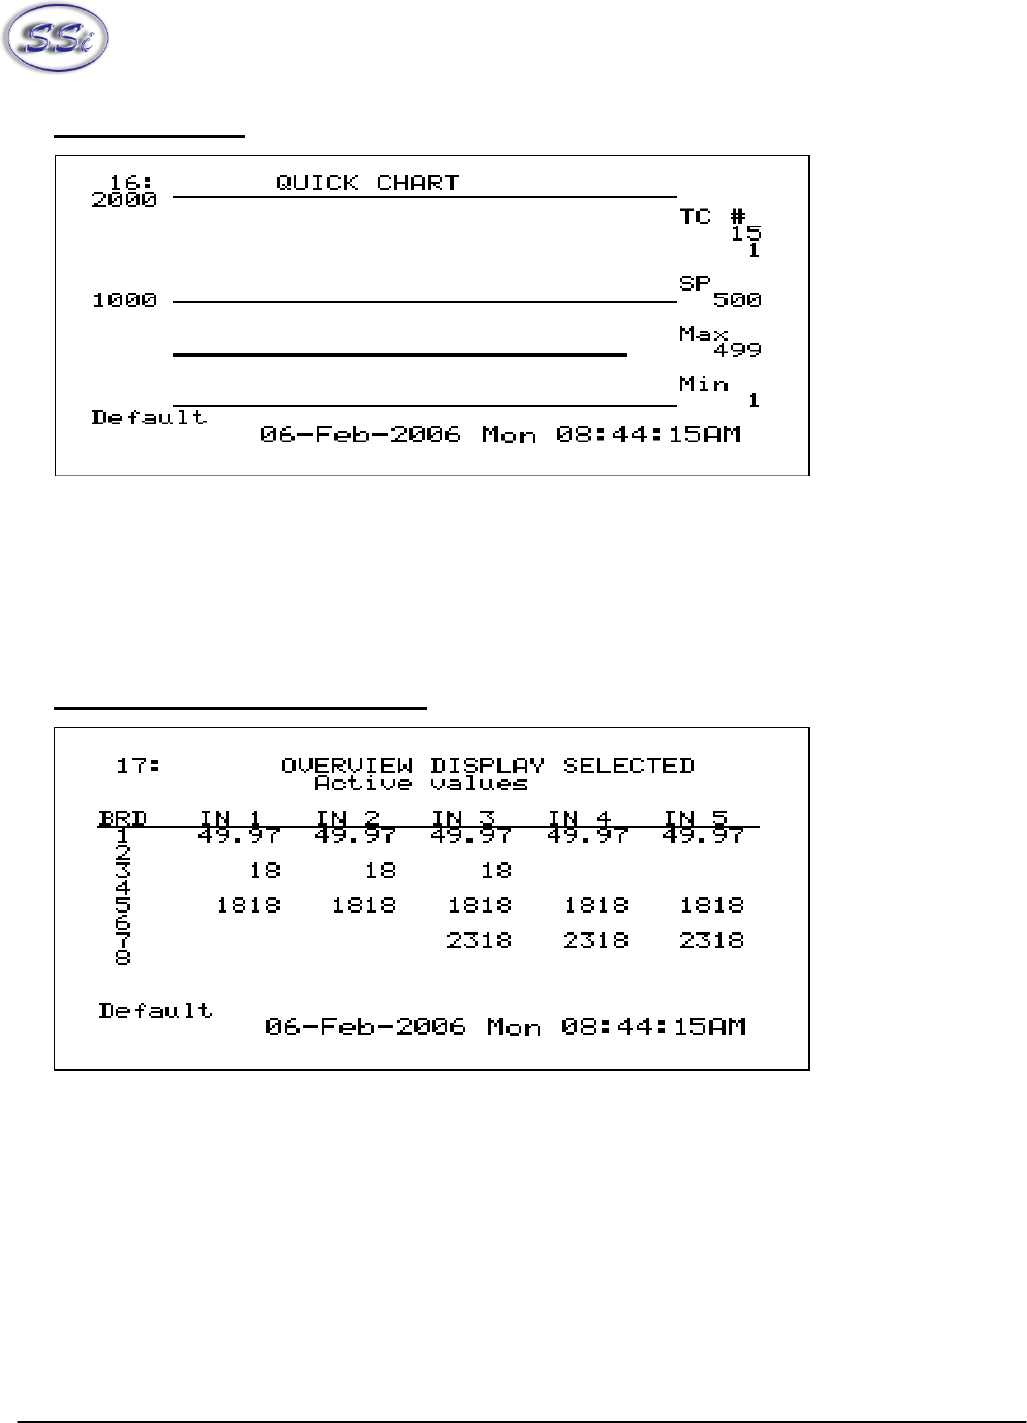
16. Quick Chart
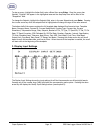
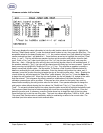
This screen displays a trend chart for one active thermocouple over a period of ninety minutes. The
information on the right displays the active thermocouple number (TC), the temperature of that
thermocouple, the Setpoint (SP), the maximum value (Max) and the minimum value (Min). The
information on the left of the screen displays the full-scale value and the middle value as reference
points. Pressing the up or down arrow keys will display the
Quick Chart Setup
screen (menu option 18).
Pressing the circular arrow key will display the
Overview Display Selected
screen (menu option 17).
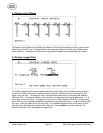
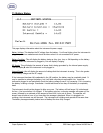
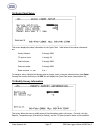
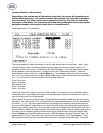
17. Overview Display Selected
This screen displays the active thermocouples on the instrument. Pressing the up or down arrow keys
will display the
Select Input Channels
screen (menu option 7). Pressing any of the number keys (1-9)
will display the corresponding menu item. Pressing the circular arrow key will cycle through the
Survey
Deviation Alarm Log
menu item (menu option 32) and the
Overview Display
screen (menu option 1). The
Deviation Alarm Log
menu item will show all deviation alarms that were logged.