


Super Systems Inc. Page 62 SDS Data Logger Manual #4565 Rev D
highlight the section of the graph that is to be enlarged. Letting go of the mouse button will enlarge the
graph.
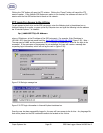
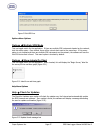
Pan Button
This will allow the user to pan to a different part of the graph. Once the cursor is over the graph, it will
change to a crosshair with arrows,
. By holding down the left mouse button and moving the mouse
left, right, up, or down, the user can move the scale of the graph by minutes or temperature, or both.
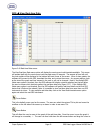
Refresh Button
This will refresh the graph and reset the graph’s display values to their default values. For the values
along the y-axis, the refresh sets the range from 0 to 2400. For the minutes along the x-axis, the refresh
encompasses approximately two hours. Note: when the Real-time screen first loads up, the graph
encompasses roughly one hour of data. The graph is marked with fifteen-minute intervals along the x-
axis.
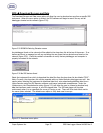
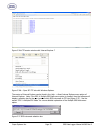
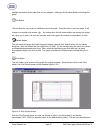
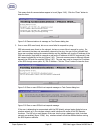
Print Button
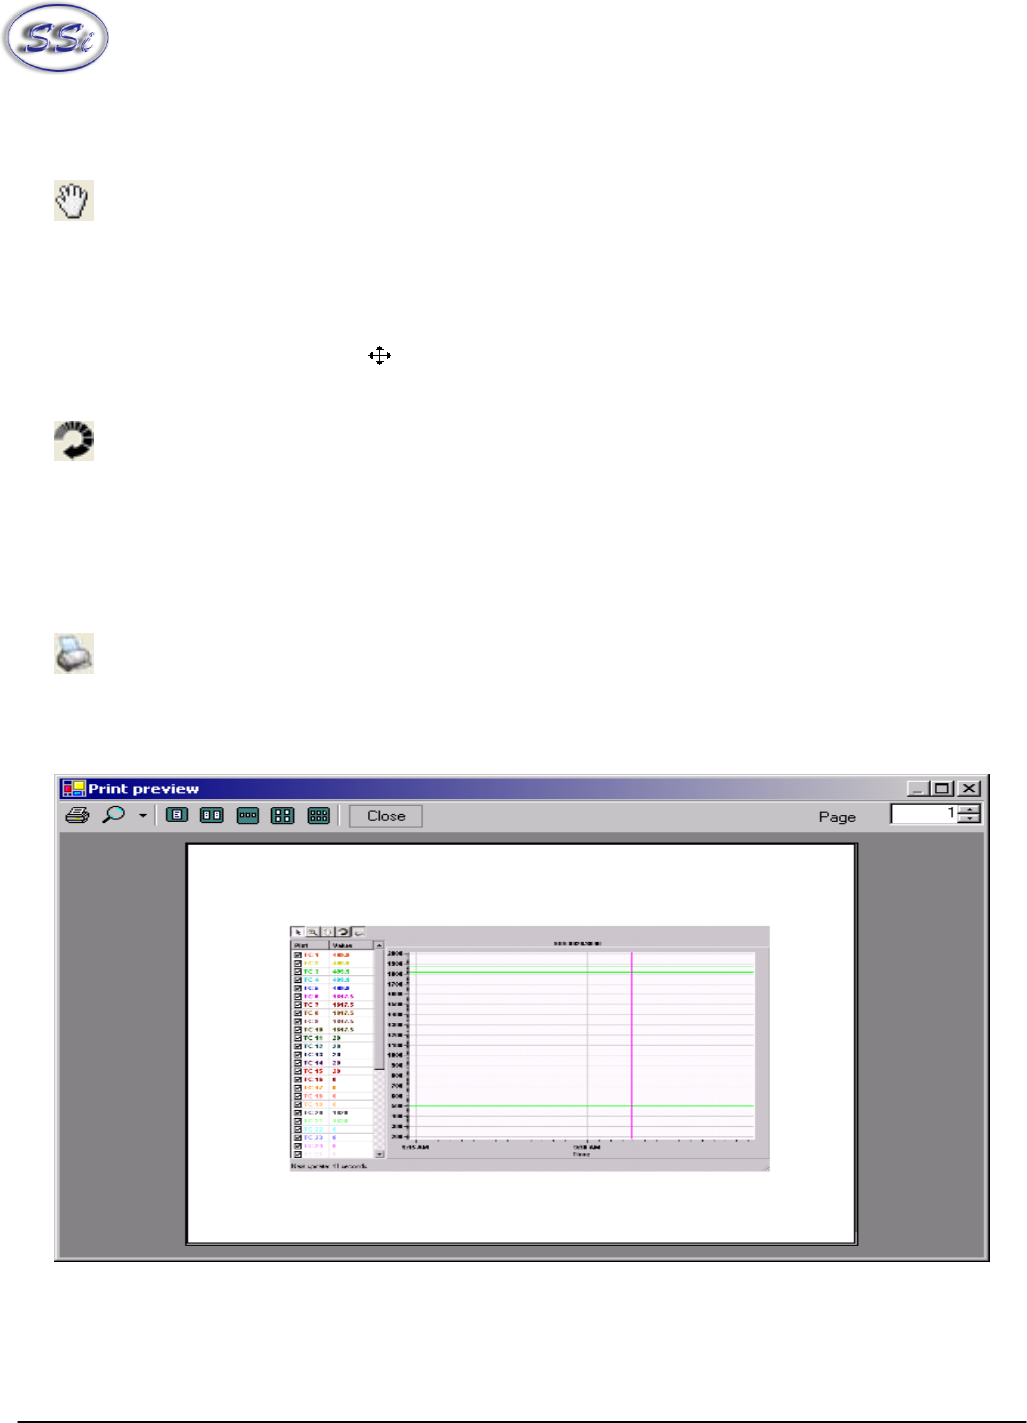
This will create a print preview of the graph for printing purposes. When the user clicks on the Print
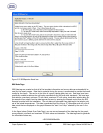
button, the Print Preview screen will be displayed (figure 2.41).
Figure 2.41 Print Preview screen
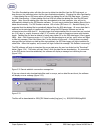
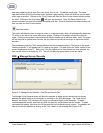
From the Print Preview screen, the user can choose to zoom in on the preview by pre-defined
percentages (10% - 500%) or leave the zoom on the default setting (auto). The user can also determine