


DUA1640-5AAA02
B-22
A
PPENDIX
B: M
ANAGEMENT
U
SING
Q
UICK
C
ONFIG
M
ANAGER
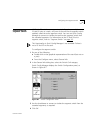
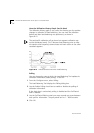
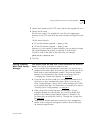
How the Utilization History Graph Can Be Used
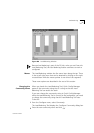
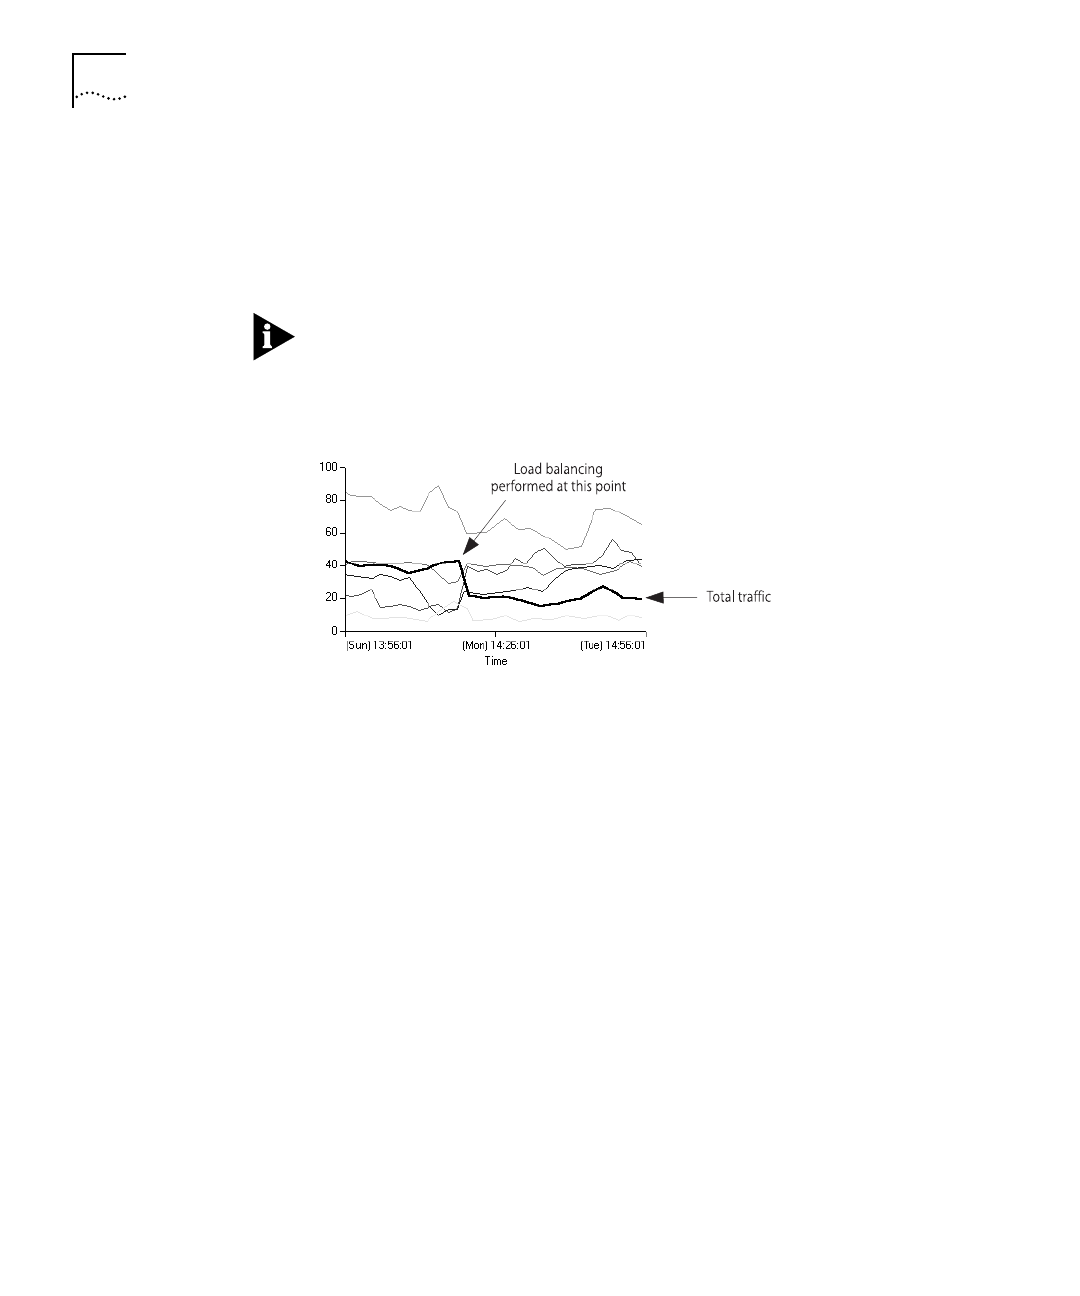
The Utilization History graph is very useful for showing you the positive
changes in utilization of load balancing. You can view the utilization
before and after load balancing was performed, as shown in
Figure B-12.
The total traffic utilization will go down but segment utilization may
not be distributed evenly. This is because load balancing tries to keep
the stations that frequently communicate with each other on the same
cascaded segment.
Figure B-12
Utilization Before and After Load Balancing
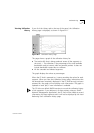
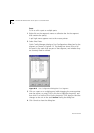
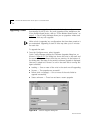
Polling
You can change the rate at which the Load Balancing Tool updates its
utilization information (called
polling
). To do this:
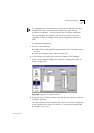
1
From the
Configure
menu, select
Polling.
The Load Balancing Tool displays the Polling dialog box.
2
Use the Enable Polling check box to enable or disable the polling of
utilization information.
If the check box is unchecked, polling is disabled and the Poll Period
field is disabled.
3
Use the Poll Period field to enter how many seconds you want between
each poll for information. The poll period can be 1 – 9999 seconds.
4
Click
OK
.