


CONFIGURE, TEST THE ENTERPRISE REPORTER USE ENTERPRISE REPORTER CANNED REPORTS
10 8E6 TECHNOLOGIES, ENTERPRISE REPORTER EVALUATION GUIDE
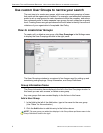
Use Enterprise Reporter Canned Reports
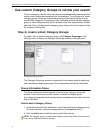
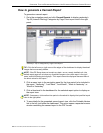
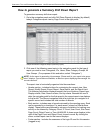
As previously stated, the first thing the administrator will see when logging into the
Enterprise Reporter is a dashboard of graphical reports called “Canned Reports”.
By viewing these reports, an administrator has an at-a-glance view of any anoma-
lous behavior that warrants an investigation.
Canned reports contain pre-generated data for a specified period of time
(Yesterday, Last Week, Last Month, Week to Yesterday, or Month to Yesterday) for
any of the following report topics or entities showing Internet activity:
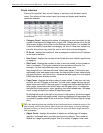
• Top 20 Users by Blocked Request - bar chart report that shows the end users
with the most attempts to view blocked content as determined by the filter
policy.
• Top 20 Categories by Page Count - bar chart report based on the total page
count for each filtering category set up in the Category Description list from the
Settings menu.
• Top 20 Users by Page Count - bar chart report based on each end user’s total
page count.
• Top 20 Users by Malware Hit Count - bar chart report based on each end
user’s total hit count from the following categories in the Security, Internet
Productivity, and Internet Communication (Instant Messaging) category groups:
BotNet, Malicious Code/Virus, Bad Reputation Domains, Spyware, Adware,
and IRC.
• Top 20 Sites by Page Count - bar chart report based on the total page count
for the most popular sites accessed by end users.
• Top 20 User Groups by Page Count - bar chart report based on the total page
count for each user group set up in the User Groupings list from the Settings
menu.
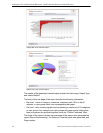
• Category Comparison - pie chart report based on the total page count for each
filtering category set up in the Category Description list from the Settings menu.
• User Group Comparison - pie chart report based on the total page count for
each user group set up in the User Groupings list from the Settings menu.
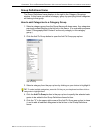
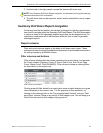
Once you have obtained an overview of Internet activity using canned reports, you
can drill down to access more detailed information about specified end user
activity.