


CONFIGURE, TEST THE ENTERPRISE REPORTER USE ENTERPRISE REPORTER CANNED REPORTS
8E6 TECHNOLOGIES, ENTERPRISE REPORTER EVALUATION GUIDE 11
How to generate a Canned Report
To generate a canned report:
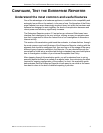
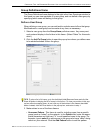
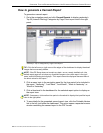
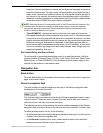
1. Go to the navigation panel and click Canned Reports to display yesterday’s
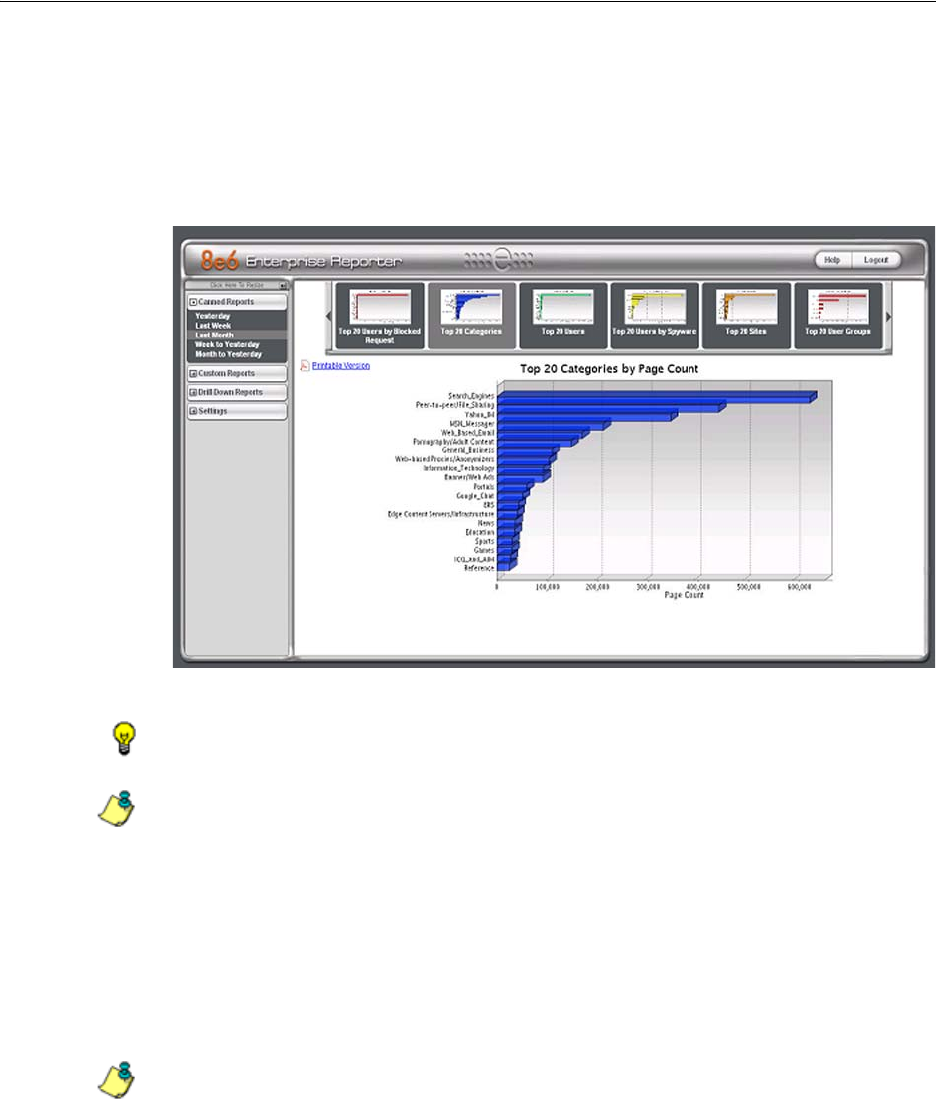
Top 20 (Internet Filtering) Categories by Page Count report view in the right
panel:
Yesterday’s Top 20 Categories by Page Count Report
TIP: Click the left arrow or right arrow at the edges of the dashboard to display thumbnail
images that are currently hidden.
NOTE: If the ER Server does not contain any data—as on a newly installed unit—the
default report page will not show any thumbnail images or bar chart report in the right
panel, and the following text displays: “This report cannot be displayed because there is
no data to show for this report.”
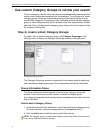
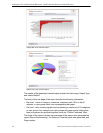
2. Click a menu topic in the navigation panel for the time period to be included in
the report: “Yesterday”, “Last Week”, “Last Month”, “Week to Yesterday”, or
“Month to Yesterday”.
3. Click a thumbnail in the dashboard for the selected report option to display as
the report view.
NOTE: If necessary, click another time period or thumbnail to display that specified report
view in the right panel.
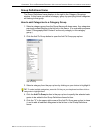
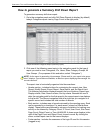
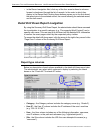
4. To see details for the generated canned report view, click the Printable Version
link to the left, just below the dashboard. This action opens a separate browser
window containing the canned report in the PDF format: