


GLOBAL ADMINISTRATOR SECTION CHAPTER 1: SYSTEM SCREEN
8E6 TECHNOLOGIES, PROXYBLOCKER USER GUIDE 95
Perform a Diagnostic Test, View Data
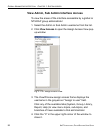
1. Select a diagnostic tool from the Command pull-down
menu: ping(Ping), traceroute(Trace Route), ps(Process
list), top(TOP CPU processes), ifconfig(NIC configura-
tion), netstat(active connections), netstat(routing table),
free(current memory usage), iostat(CPU usage),
sar(system performance), recent logins, uptime(system
uptime), df(disk usage), and dmesg(print kernel ring
buffer).
NOTE: See Command Selections for a list of commands and
their functions.
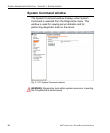
If “Ping” or “Trace Route” was selected from the pull-
down menu, a blank field displays to the right and must
be populated.
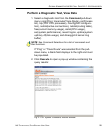
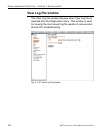
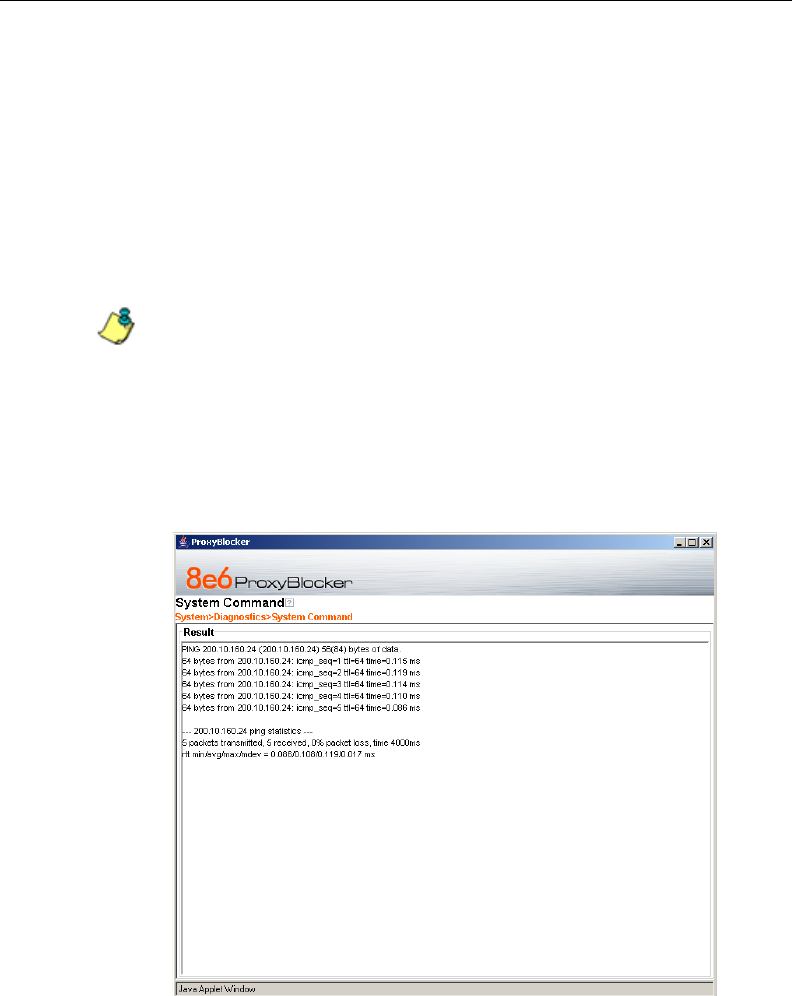
2. Click Execute to open a pop-up window containing the
query results:
Fig. 2:1-29 System Command, Results window