


Chapter 3
18 Avaya C460 SMON User Guide
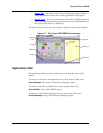
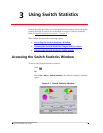
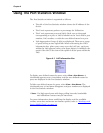
Switch Statistics displays information using different types of graphs:
• Gauges that show error packets and capacity.
• A pie chart that shows the ratio of Unicast, Broadcast, and
Multicast packets.
• A pie chart that shows the ratio of packets by priority.
• A traffic graph section that contains line graphs describing the
characteristics of the traffic traveling through the switch.
The title of the Switch Statistics window displays the Device IP Address.
The gauges, pie charts, and bar graph show data for the latest time
currently visible on the traffic graph. For more information, refer to
“Viewing the Switch Statistics Traffic Graph” on page 19
.
You can use the gauges, pie charts, and traffic graph to view data from an
earlier point in time by scrolling the traffic graph. For more information
about modifying the display, refer to “Using the Options Dialog Box” on
page 74. For more information on the available toolbar, status bar, and
mouse movement options, refer to “Working with Device SMON Tools”
on page 14.
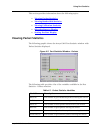
Viewing the Switch Statistics Gauges and Pie
Charts
The gauges at the top of the window display the following information:
Table 3-1. Gauge Variables in Switch Statistics
Variable Description
Errors Displays the percentage of packets that contain errors going
through the device on a logarithmic scale. If this
percentage is high, this indicates that there may be a
problem.
Capacity Displays the proportion of traffic in relation to the device’s
configured capacity, as a percentage. If the capacity used
nears the device’s total capability, this indicates there may
be a problem.