Chapter 5
34 Avaya C460 SMON User Guide
SMON updates these pie charts in real-time according to the specified
sampling interval. By viewing the relationships among these variables,
you can learn a lot about the traffic on the port.
* Note: If contact with the device is lost, the graphs will display the
last data received until communications are restored.
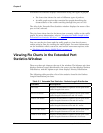
Viewing the Traffic Graph in the Extended Port
Statistics Window
The lower portion of the Extended Port Statistics window is a traffic
graph. The traffic graph displays selected variables as a line graph, in real-
time.
The X axis of the graph represents time. The units of the Y axis for all
variables are packets. The scale on the Y axis depends on the maximum
value among all of the variables. If the spread of values is wide, the graphs
of variables with small values may not be visible. In this case, use the
logarithmic traffic display to produce better results (refer to “Logarithmic
Display” on page 78).
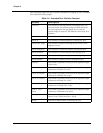
Priority 5 Displays the distribution of packets of priority 5 entering the
port.
Priority 6 Displays the distribution of packets of priority 6 entering the
port.
Priority 7 Displays the distribution of packets of priority 7 entering the
port.
Table 5-3. Extended Port Statistics - Priority Distribution (Continued)
Variable Description


