


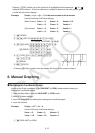

5-12
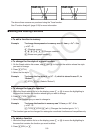
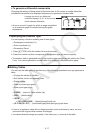
Pressing (SEL) while one of the function’s is highlighted would causes its “
R
” or “
B
”
indicator to be cleared. A function without an indicator is drawn as the main screen graph
(on the left side of the display).
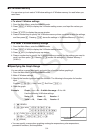
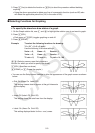
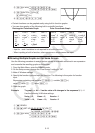
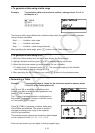
Example Graph
y = x(x + 1)(x – 1) in the main screen and sub-screen.
Use the following V-Window settings.
(Main Screen) Xmin = –2, Xmax = 2, Xscale = 0.5
Ymin = –2, Ymax = 2, Yscale = 1
(Sub-screen) Xmin = –4, Xmax = 4, Xscale = 1
Ymin = –3, Ymax = 3, Yscale = 1
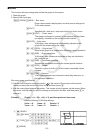
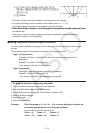
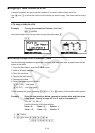
K GRAPH
K(SET UP)_AAAA*(G+G))
*fx-7400G
ɉ, fx-9750Gɉ: AAA
(V-WIN) AUAU?DUA
AUAU@U
(RIGHT) CUCU@UA
BUBU@U)
(TYPE)(Y=)TT@
T@U
(DRAW)
*(COPY)
• Pressing while a graph is on the display will return to the screen in step 4.
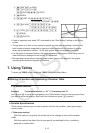
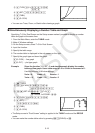
6. Manual Graphing
I Rectangular Coordinate Graph
Inputting the Graph command in the RUN•MAT (or RUN) mode enables drawing of
rectangular coordinate graphs.
1. From the Main Menu, enter the RUN•MAT (or RUN) mode.
2. Make V-Window settings.
3. Input the commands for drawing the rectangular coordinate graph.
4. Input the function.
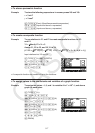
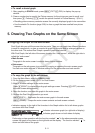
Example Graph
y = 2x
2
+ 3x – 4.
Use the following V-Window settings.
Xmin = –5, Xmax = 5, Xscale = 2
Ymin = –10, Ymax = 10, Yscale = 5
K RUN
•
MAT (or RUN)