


6-20
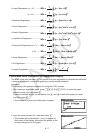
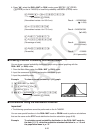
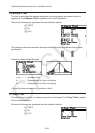
4. Press K, select the RUN•MAT (or RUN) mode, press *(E)(PROB)
((PROB) on the fx-7400G
II) to recall the probability calculation (PROB) menu.
(PROB)*(E)(
t() @E?DU
* fx-7400G
II: (PROB)
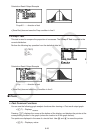
(Normalized variate
t for 160.5 cm) Result: –1.633855948
(
–1.634)
(t() @FDDU
(Normalized variate
t for 175.5 cm) Result: 0.4963343361
( 0.496)
(P()?CHE
(P()@EBCU
(Percentage of total) Result: 0.638921
(63.9% of total)
(R()?CHEU
(Percentile) Result: 0.30995
(31.0 percentile)
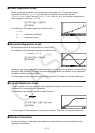
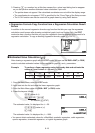
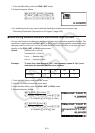
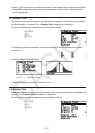
I Drawing a Normal Probability Distribution Graph
You can draw a normal probability distribution graph using manual graphing with the
RUN•MAT (or RUN) mode.
1. From the Main Menu, enter the RUN • MAT (or RUN) mode.
2. Input the commands to draw a rectangular coordinate graph.
3. Input the probability value.
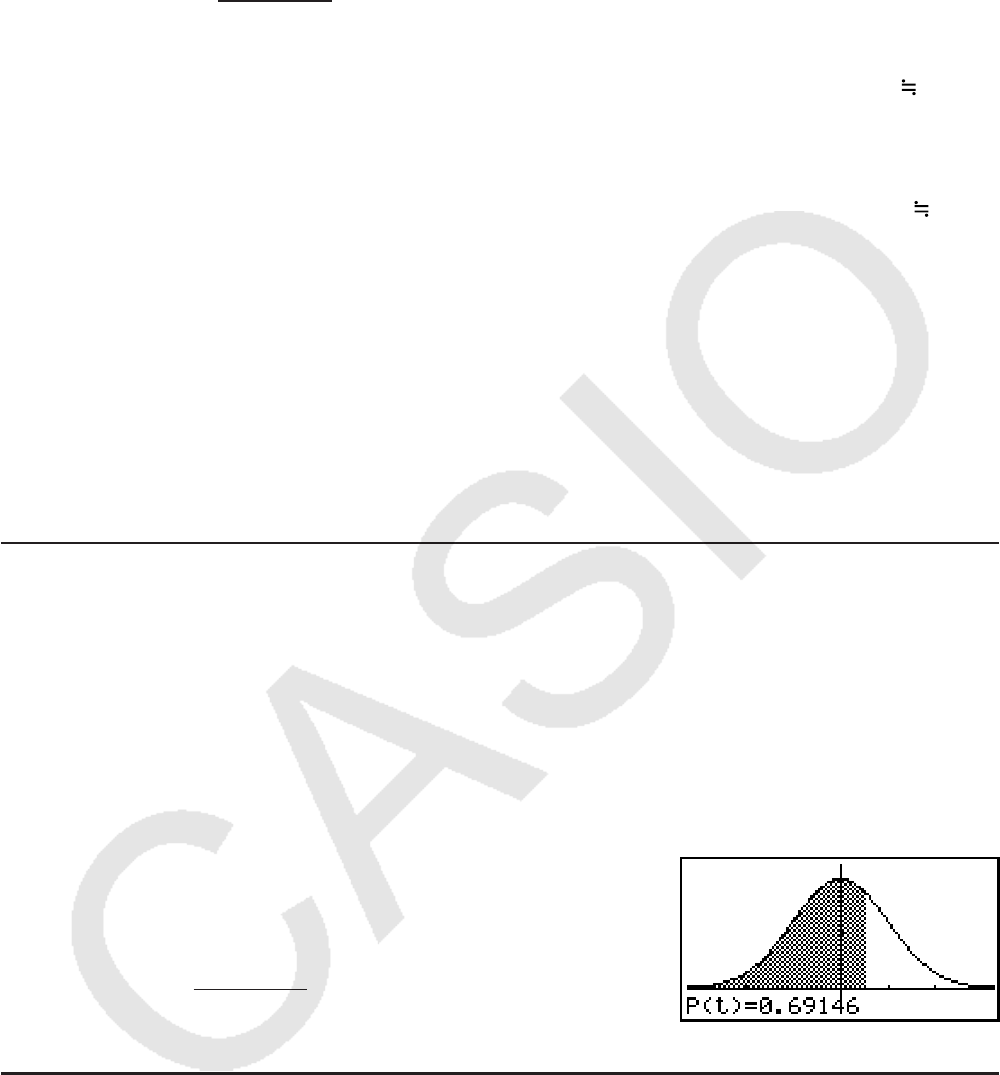
Example To draw a normal probability P (0.5) graph.
K RUN • MAT (or RUN)
(SKTCH)(Cls)U
(GRPH)(Y=)
*(E)(PROB)*(E)(P()?DU
* fx-7400G
II: (PROB)
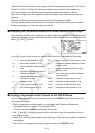
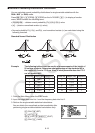
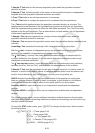
I Calculations Using the Distribution Function
Important!
• The following operations cannot be performed on the fx-7400GII.
You can use special functions in the RUN•MAT mode or PRGM mode to perform calculations
that are the same as the STAT mode distribution function calculation (page 6-38).
Example To calculate normal probability distribution in the RUN • MAT mode for
the data {1, 2, 3}, when the population standard deviation is
S
= 1.5 and
the population mean is ƫ =2.