


20051101
8-3
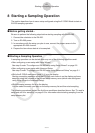
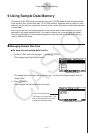
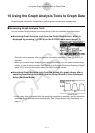
Starting a Sampling Operation
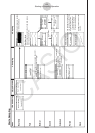
Mode
Real-time
Fast
Normal
Sound
Extended
Period
Clock
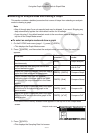
1. EA-200 Setup 2. Start Standby 3. Sampling 4. Graphing
Starts Sampling
• The screen shown below appears when CH1,
SONIC, or Mic is used as the trigger.
Graph screen does not show all sampled values,
but only a partial preview.
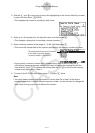
Pressing 1 advances to
“4. Graphing”.
Pressing w there returns to
“3. Sampling”.
w
ww
w
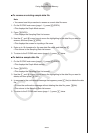
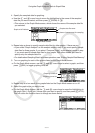
The following three graph types
can be produced when Photo-
Gate-Pulley is being used.
1.
Time and distance graph
2.
Time and velocity graph
3.
Time and acceleration graph
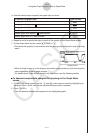
Sample values is stored as List
data only.
• When Number of Samples = 1
•
When Number of Samples > 1
Input values.
w
Sampled values are saved as
Current Sample Data.
•
When Mode = Sound
Outputting through
speaker
20070101