


9-18
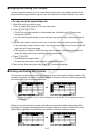
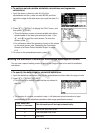
S To perform paired-variable statistical calculations and regression
calculations
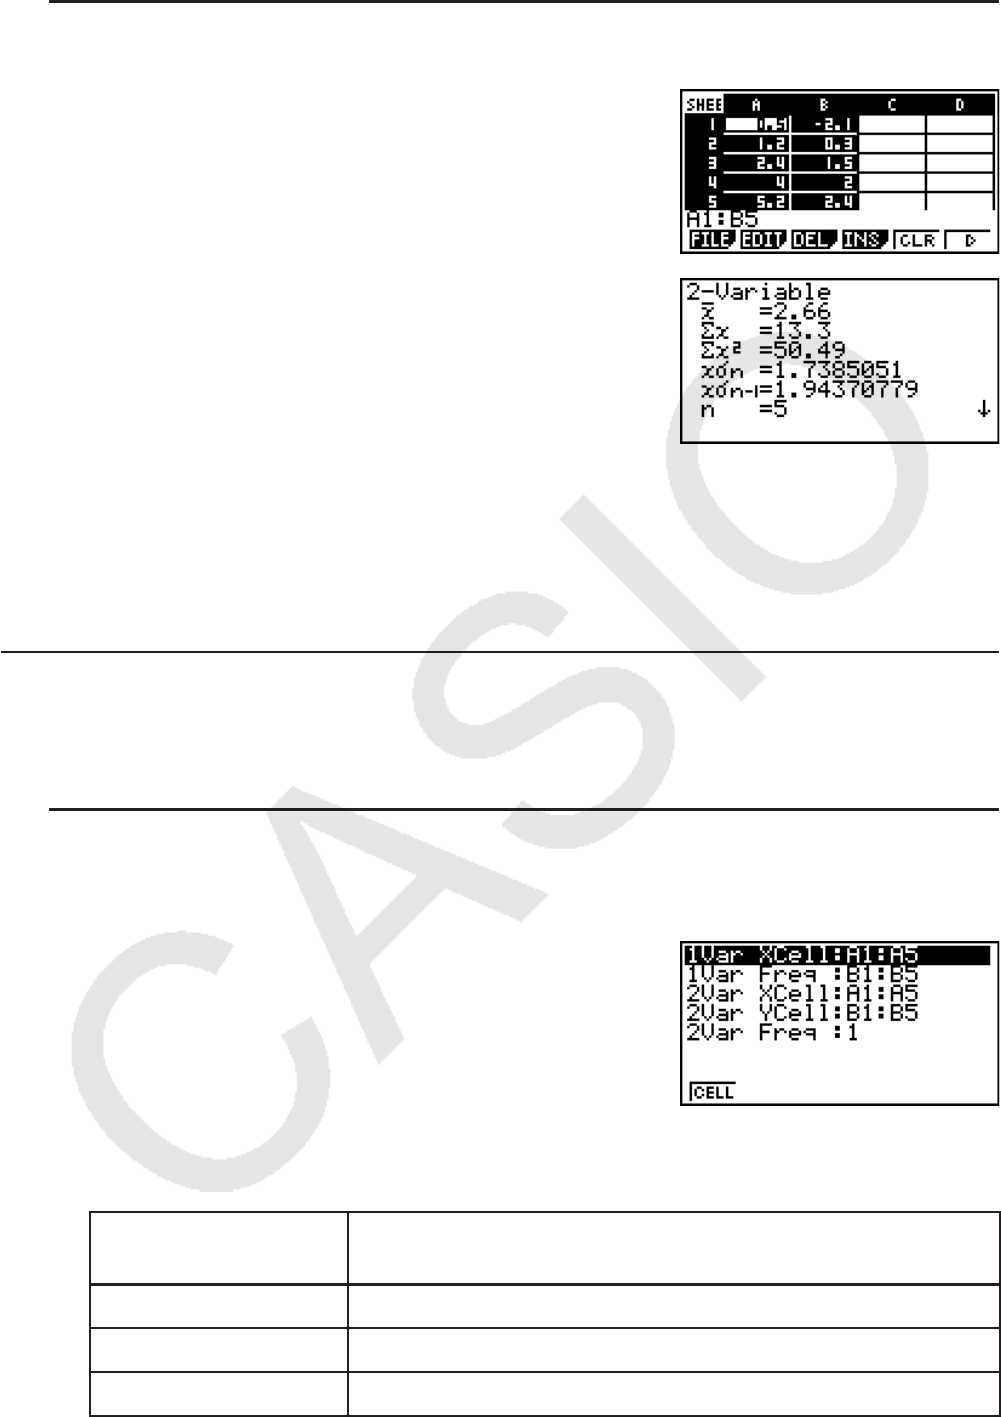
1. Input the above x-data into cells A1:A5 of the
spreadsheet and the y-data into cells B2:B5, and then
select the range of the cells where you input the data (A1:
B5).
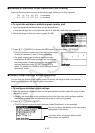
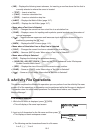
2. Press (E)(CALC) to display the CALC menu, and
then press (2VAR).
• This will display a screen of paired variable calculation
results based on the data you selected in step 1. Use
C and B to scroll the result screen. To close the
screen, press ).
• For information about the meaning of each of the values
on the result screen, see “Displaying the Calculation
Results of a Drawn Paired-Variable Graph” on page
6-14.
3. To return to the spreadsheet screen, press ).
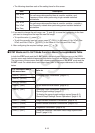
I Using the Statistical Calculation Data Range Specification Screen
You can use a special setting screen to specify the range of data to be used for statistical
calculation.
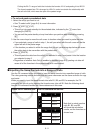
S To specify the data range for statistical calculation
1. Input the statistical calculation data into the spreadsheet and then select its range of cells.
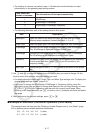
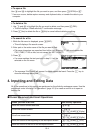
2. Press (E)(CALC)(SET).
• This will display a setting screen like the one shown to
the right.
• The number of columns you select in step 1 will determine what information is input
automatically on the statistical calculation data range specification screen.
If you select this
number of columns:
This information will be input automatically:
1 1Var XCell and 2Var XCell
2 1Var Freq and 2Var YCell
3 2Var Freq