


8-15
DrawFTG-Con, DrawFTG-Plt
No parameters
Function: This command uses values in a generated table to graph a function.
Description:
• This command draws a function graph in accordance with conditions defined within the
program.
• DrawFTG-Con produces a connect type graph, while DrawFTG-Plt produces a plot type
graph.
DrawGraph
No parameters
Function: This command draws a graph.
Description: This command draws a graph in accordance with the drawing conditions defined
within the program.
DrawR-Con, DrawR-Plt
(Not included on the fx-7400G
II) No parameters
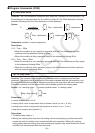
Function: These commands graph recursion expressions, with a
n
(b
n
or c
n
) as the vertical axis
and n as the horizontal axis.
Description:
• These commands graph recursion expressions in accordance with conditions defined within
the program, with
a
n
(b
n
or c
n
) as the vertical axis and n as the horizontal axis.
• DrawR-Con produces a connect type graph, while DrawR-Plt produces a plot type graph.
DrawR3-Con, DrawR3-Plt
(Not included on the fx-7400G
II) No parameters
Function: These commands graph recursion expressions, with 3a
n
(3b
n
or 3c
n
) as the vertical
axis and n as the horizontal axis.
Description:
• These commands graph recursion expressions in accordance with conditions defined within
the program, with 3
a
n
(3b
n
or 3c
n
) as the vertical axis and n as the horizontal axis.
•DrawR3-Con produces a connect type graph, while DrawR3-Plt produces a plot type graph.
DrawStat
Function: This draws a statistical graph.
Syntax: See “Using Statistical Calculations and Graphs in a Program” on page 8-25.
Description: This command draws a statistical graph in accordance with conditions defined
within the program.
DrawWeb
(Not included on the fx-7400G
II)
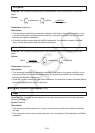
Function: This command graphs convergence/divergence of a recursion expression (WEB
graph).
Syntax: DrawWeb <recursion type>[, <number of lines>]=
Example: DrawWeb
a
n
+1
(b
n
+1
or c
n
+1
), 5=
Description:
• This command graphs convergence/divergence of a recursion expression (WEB graph).
• Omitting the number of lines specification automatically specifies the default value 30.